| Last visit was: 25 Apr 2024, 03:22 |
It is currently 25 Apr 2024, 03:22 |

Customized
for You
Track
Your Progress
Practice
Pays
| FROM Cranfield SOM Blogs: Forensic Institute Transformation – Part Two |
|
Equipment purchases begin! A major part of our CranfieldForensic Institute transformation is acquiring new equipment for forensic teaching and research. This week, I approved the first few equipment orders (worth in excess of £250,000) and we hope to install the brand new kit as soon as the building is ready in the summer. The first set of orders included one very significant piece of equipment, a virtual autopsy table, which will be a new teaching and research aid for us. The table is one of the most technologically advanced virtual dissection tables in anatomy education and allows students to be taught in a unique, dynamic and engaging manner.  Image: Anatomage You will see in the images, included with this blog, the details of the equipment we have ordered, but the idea is that students will get to experience multiple clinical examples of autopsies and manipulate them as three dimensional images, allowing sectioning and density differentiation. This equipment will play a big part in our forensic anthropology teaching, led by DrNick Marquez-Grant. For those who are more interested in ballistics, we also ordered two new comparison microscopes. This equipment allows scratches caused by a weapon on rounds to be compared, linking a weapon to a scene or victim. They will be central to our forensic ballistics teaching and research. Additionally, the new equipment will be used for MSc theses, where our students specialise in individual research projects under a staff supervisor. 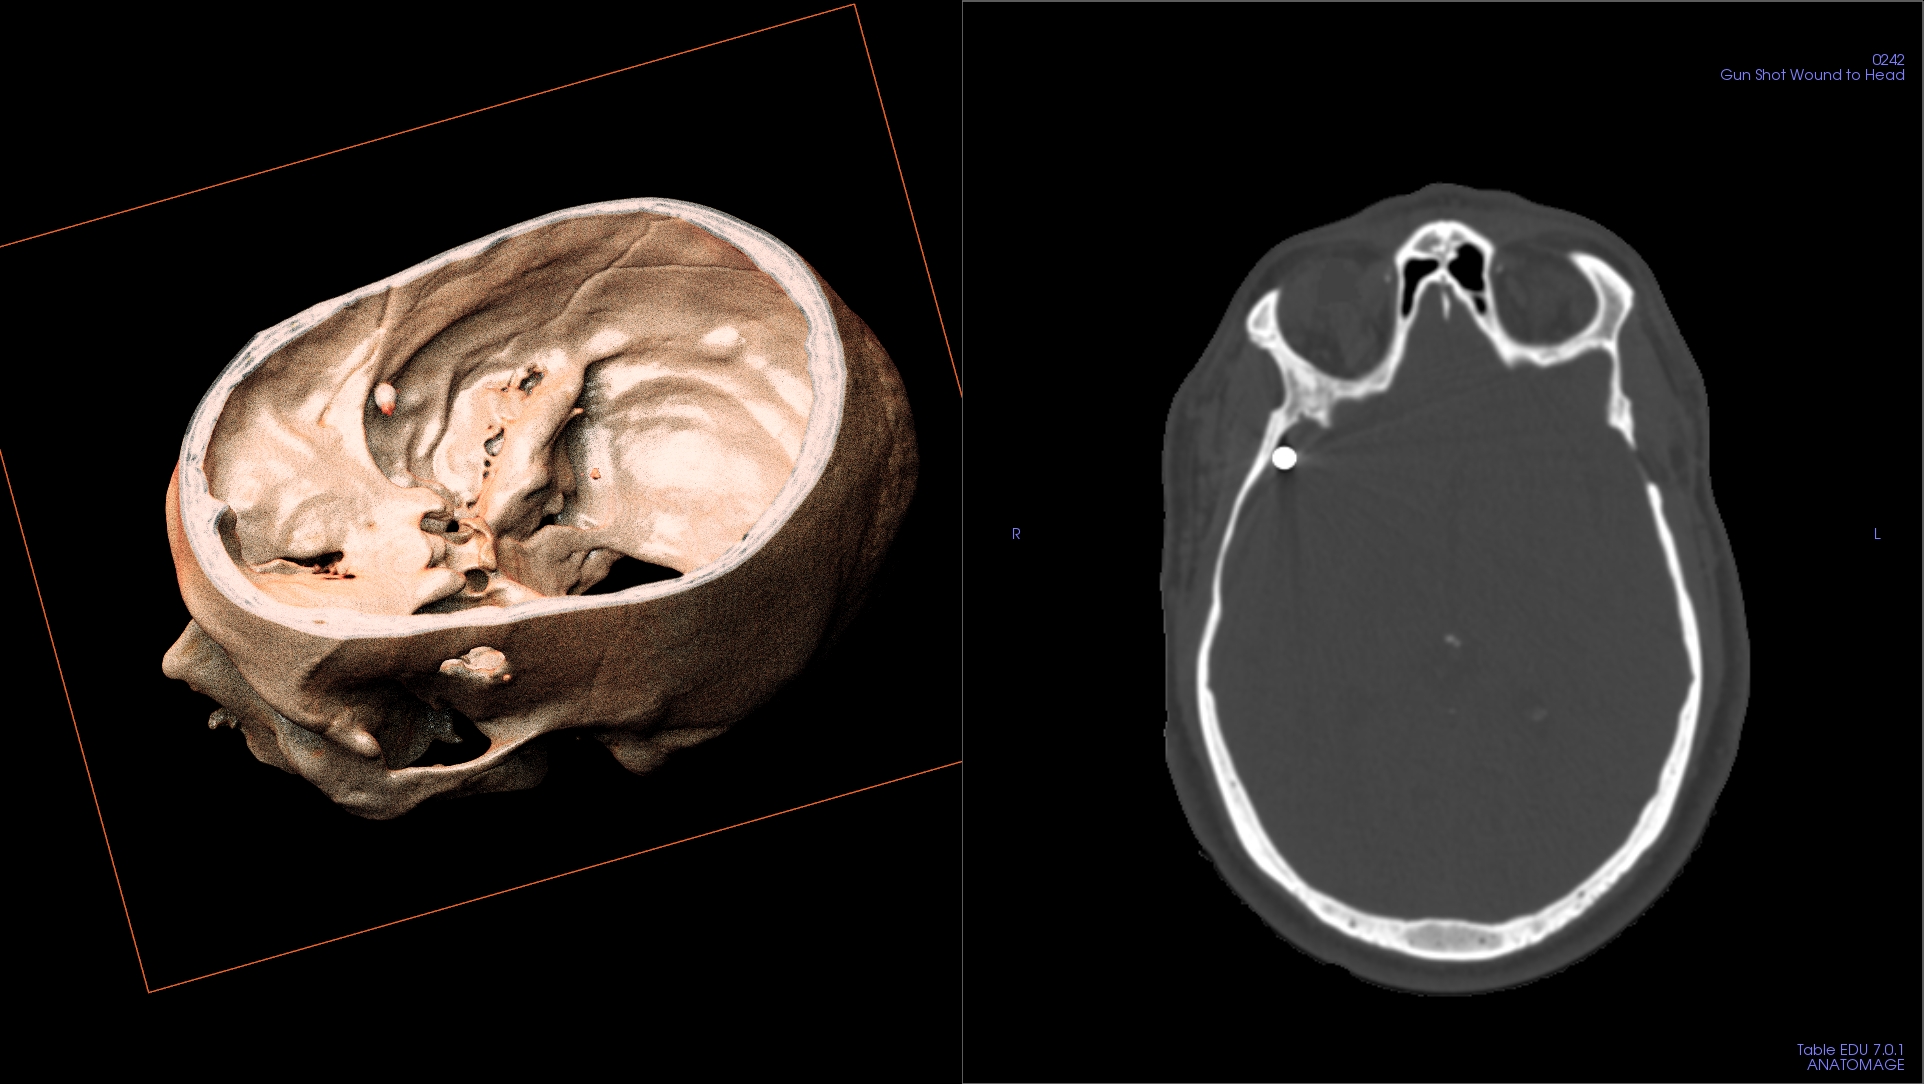 We want to let you know how the move and transformation is progressing every step of the way so please make sure to keep an eye out for my next update, coming soon! Header image credit: Anatomage |
| FROM Cranfield SOM Blogs: Introducing… MarketLine Advantage |
Researching a company, industry or country? Have you looked at MarketLine yet? Whether you need company profiles, industry reports or country PESTLE analyses, MarketLine can help.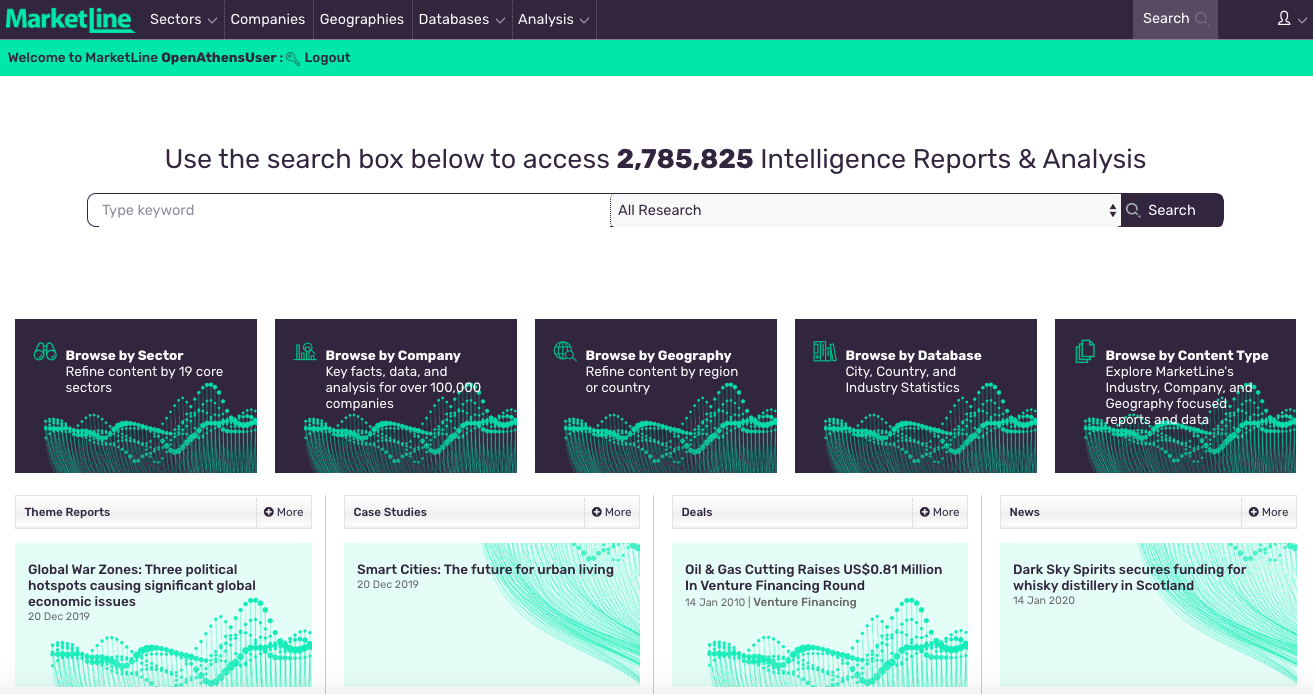 The search function is really simple. Type in what you’re looking for and use the ‘All research’ dropdown menu to select your category – Companies, Countries, or Industries (amongst others) – then click to search. That’s it! Company Profiles Documents containing information on company history, key employees, revenue analysis, SWOT analysis and details of key competitors. Available for larger companies worldwide. Country Reports Published every 12-18 months, these feature an overview and key facts, in addition to in-depth PESTLE analysis. Graphs can be exported to Word, PDF and Excel. Industry Profiles Country-specific reports including market data, segmentation analysis, market outlook, profiles of leading companies and macroeconomic data in addition to a Porter’s Five Forces analysis. All can be downloaded with ease. If you have any questions about MarketLine or any of our other resources, feel free to contact MIRC or Kings Norton Library. |
| FROM Cranfield SOM Blogs: MIRC resources for due diligence |
|
With VCIC running this week, we felt a little something on due diligence might be in order… If you’re researching a company with a view to an investment or acquisition, due diligence will be of utmost importance. Although much of the data and information required for this exercise will come from the target company itself, there are various areas here where our Library resources can help. Also bear in mind that library resources might be more comprehensive than the (possibly selective) data the target company provides. Financial Data: The chances are that the company you are looking at will be private. Financials for firms – public and private, large and small – in the UK and Ireland are available in Fame and Capital IQ. Publicly listed companies worldwide are best covered by Capital IQ, Thomson One and Bloomberg. Fame: Through Fame, you can access up to ten years of financial data – including balance sheets, profit and loss and cash-flow where appropriate. Copies of original Companies House filings are available too. You can also view data on comparable companies via Fame’s Peer Report and Peer Analysis functions.  Capital IQ: Capital IQ provides financials for companies worldwide. Peer analysis is available for both public and larger private firms. Financials – including balance sheets and income statements (for private companies) and a huge amount more for listed companies are available back to the 1980s along with a wide variety of ratios, transaction information and details on business relationships. Find out how to sign up for your Capital IQ account here. Thomson One: Thomson One will give you balance sheets, income statements and cash-flow back to the 1980s, along with a wide variety of financial ratios, revenue segmentation, financial transactions and forecasts. Comparable analysis is readily available for pre-defined or customised peer groups. Access is also available to brokers’ reports for expert analysis on both company and industry. Bloomberg: Bloomberg’s <FA> (Financial Analysis) function gives you access to a wealth of company financials including estimates and forecasts for listed companies worldwide – such as stock data, balance sheets, cash flow, income statements, profit and loss and ratios. Comparables are accessible through any company report, as are segmentation data and brokers’ reports. Bloomberg is only accessible from dedicated terminals in the School’s Bloomberg Suite. Industry & Market Research: You will also need a thorough knowledge and understanding of the industry and market in which the company operates along with its technologies and operations. Use industry research available via MarketLine Advantage and IBISWorld to research the key drivers, industry performance and outlook and major players. FitchConnect (previously BMI Research) may be useful here too. When it comes to the market, you need to know that there are customers out there who want to buy your company’s products or services. Use Mintel (UK) and Passport for market research. Resources listed below will also provide information on the business environment, both legal and environmental, that the company operates in. If you’re interested in ESG filings, use Bloomberg. IBISWorld: IBISWorld provides concise industry reports for UK, US and global markets, covering performance and outlook (including some forecasts), competitive landscape, and operating conditions. It also situates a company within its supply chain, highlighting demand and supply industries which will impact on yours. 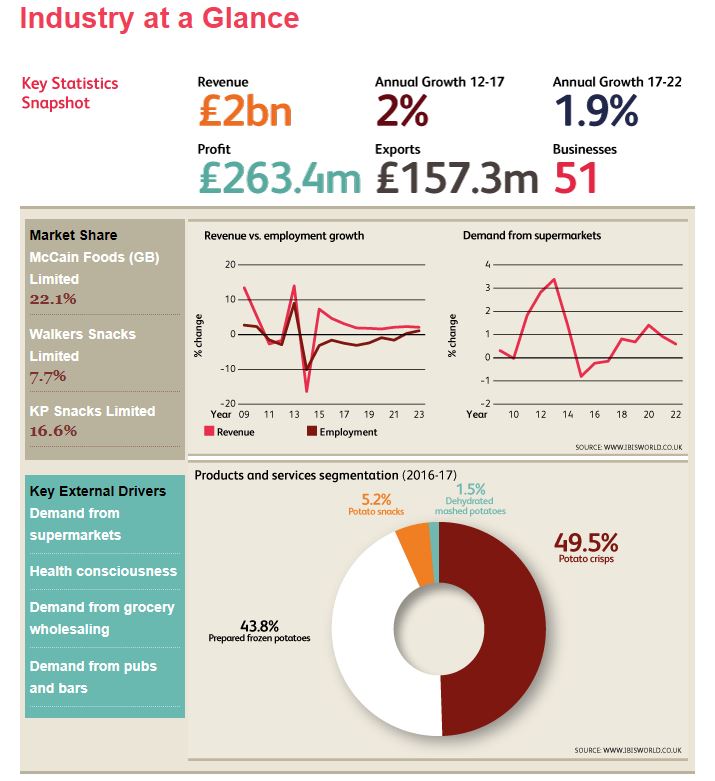 MarketLine: In addition to the industry overview and outlook, MarketLine reports are built around a Five Forces Analysis which provides a framework from which to analyse the competitive forces which shape any industry. FitchConnect: Previously available on the BMI Research platform, FitchConnect provides quarterly industry reports on a wide range of major industries worldwide. Reports are much broader in outlook to those in IBISWorld, but include both 5 and 10 year forecasts for the sector. Mintel: Mintel covers most of the UK’s consumer markets. Reports are updated every 12 to 24 months. Within a report you will have access to analysis on the UK market, including market drivers, size, segmentation and forecasts; consumers and their attitudes, and research on major brands and players in the market. Downloadable databooks are also available to accompany most reports. Passport: Passport’s country-specific ‘category briefings’ are concise market reports for most consumer goods markets worldwide which cover headlines, trends, competitive landscape and prospects. They include links to related reports and statistics. Bloomberg: Primarily a financial tool, Bloomberg is our main source of ESG data for listed companies. This area, environmental, social and governance, covers what Investopedia refer to as “a set of standards for a company’s operations that socially conscious investors use to screen investments”. People: When you invest in a company, you also invest in its people. You will want to know everything you can about the company management team, their business interests and what they bring to the organisation. Fame: Run a Director search on Fame from the homepage. From there you can view other directorships individuals may hold (both past and present) within the UK and Ireland. Thomson One: View past and present company directorships for named individuals in listed companies worldwide via the Screening & Analysis menu.  Bloomberg: Biographies are available for prominent business people, global figures along with Bloomberg users. Research their life and work both past and present – education and career history, board memberships and publications. Use the <BIO> function to find these.  If you have any questions at all about any of the resources mentioned here, please contact MIRC. Feature image from Pixabay. Available at: https://cdn.pixabay.com/photo/2016/09/19/18/30/calculator-1680905_960_720.jpg |
| FROM Cranfield SOM Blogs: Addressing the FAIR data principles when managing research data |
 In the context of open science the goal of many research funders is that the research data from funded projects are deposited as open data in a digital repository, e.g. CORD FAIR is an acronym to help you remember your key goals for managing your research data, and you should build this into your research plan from the start. Your data should be Findable, Accessible, Interoperable and Reusable. To achieve FAIRness, datasets should be available online in a searchable resource, e.g., a catalogue, data repository or archive, and at least have:
Findable
Accessible Not all data can be made openly available and FAIR does not mean that data need to be open. As a rule of thumb data should be ‘as open as possible, as closed as necessary’.
Interoperable Data and metadata should conform to widely used file formats and disciplinary standards for data collection should be used where possible to allow your data to be combined and re-used with other data.
Reusable A lot of documentation is needed to support data interpretation and reuse. The data should conform to community norms and be clearly licensed so others know what kinds of reuse are permitted.
Useful resources
Image from https://www.openaire.eu/open-research-data-the-new-norm-in-h2020 |
| FROM Cranfield SOM Blogs: A closer look into the warehouse of a high street fashion brand |
|
As part of our second term of the Logistics and Supply Chain MSc we got the opportunity to join a warehouse visit. In my case we went to the River Island distribution centre (DC). Luckily Cranfield School of Management benefits from being in the middle of a logistically important area in the UK. Hence there are plenty of newly established warehouses around the area of Milton Keynes due to its strategic location close to London. Even though for me this was not the first chance to have a closer look at warehouse operations, it was still an exciting visit especially regarding the fashion supply chain specific processes that we saw. River Island operates only this one warehouse worldwide which requires the warehouse to serve all the different sales channels, such as online retailing, wholesalers and deliveries to own stores across Europe as well as distribution to international stores. Thus, River Island has developed their products in a so-called “Omni product” manner to create a “one-fits-all (distribution channel)” product. We were able to get a tour through the 90,000 m2 warehouse which is split into two purpose build warehouses covering all processes from “goods in” until the outbound processes where lorries are loaded with the respective orders bringing fashion to its final customer. For their top 50 stores across the UK, River Island ensures a 24-48 hrs time frame from the moment the cartons enter the warehouse until they are received by the dedicated store. On a regular day, the warehouse handles around 10,000 incoming cartons which can increase up to 15,000 – 16,000 cartons during peak times. However, no matter how much is received, the company puts its highest priority on the accuracy and quality of the received goods. There are multiple spot checks done based on the company’s accuracy standards also considering for instance the accuracy ranking of the different suppliers that produce the men’s, women’s and kids wear as well as a wide range of shoes and accessories. The credo that is followed here refers to keeping any errors and the number of items with insufficient quality as low as possible from the beginning to have the highest quality output when products are leaving the warehouse. Besides their accuracy it was also interesting to see that one part of their warehouse is solely dedicated to storing up to 1,500,000 meters of fabrics that are used to produce hanging garments around Europe. This is very unique in the fashion industry where warehouses usually store ready to sell clothing items instead of raw fabric that is delivered to production facilities. Overall the hanging garments were one of the most exciting part for me as they are stored and transported in an entirely different way through the warehouse. In one part of the warehouse there is a railing structure installed at the ceiling where the hangers are connected to. In this way, the products are stored and moved throughout the warehouse until they end up at the outbound loading docks. The hanging clothes are literally flying down from the first mezzanine floor to the ground floor for loading, which was exciting to see. Lastly, I was especially impressed by the experience of the team that was guiding us. Two of the senior managers took the time to give us a detailed tour covering as many of our questions as possible. Both senior managers combined had more than 44 years of River Island experience and they had both started their careers on the shop floor. The broad knowledge covering both operational and more strategical topics was remarkable. Thanks again to Cranfield School of Management for making this warehouse visit happen and for allowing everyone to get a better feeling for what is actually happening on the shop floor and adding some practical examples in addition to our regular lecture material. |
| FROM Cranfield SOM Blogs: Cranfield and Exeter’s journey to Esrange Space Center in Sweden for the BAMMsat project |
|
Header image: A beautiful aurora for our last day at Esrange. We are a team BoB (BAMMsat-on-BEXUS). Thanks to the REXUS/BEXUS programme, we will be launching a version of Cranfield bioCubeSat programme called BAMMsat. Thanks to the REXUS/BEXUS student program, organised by a bilateral agreement between the Swedish National Space Agency (SNSA) and the German Aerospace Center (DLR) we can fly our hardware on a high-altitude balloon this October at Esrange Space centre in Sweden. This is a continuation of our last blog on the selection of the project at ESTEC, the technical centre of the European Space Agency (ESA) in the Netherlands. https://blogs.cranfield.ac.uk/aerospace/cranfield-and-exeters-journey-to-the-european-space-technology-centre-estec A quick recap about BAMMsat-on-BEXUS. Our objective is to increase access to space for biology researchers by providing a cheap and reliable platform to perform biological experiments in space. Researchers could run experiments on complex life forms such as C. elegans worms or human cells culture for example. Currently, with BAMMsat-on-BEXUS, we are aiming to perform a technology and operation demonstration of a CubeSat to show to the science community the possibilities of such a platform. After the selection at ESTEC, the next phase of the project was the Preliminary Design Review (PDR) that took place between the 10th and 14th of February at Esrange Space Centre in Sweden. Our preliminary design was reviewed by a panel of experts. We also had a full week of training alongside other teams of students from all over Europe. For the review, we looked in more detail about the technical and financial feasibility of the project. We have looked at the compatibility of our technology and our launch vehicle: the BEXUS30. Because of our biological payload (living organisms) we have a lot of pre-flight operational requirements and constraint. Due to that, we have to carefully plan our launch campaign operations i.e., before the launch, the shipment, the growth of the worms, the implementation and the wait time before launch. This can be quite complicated and difficult to manage especially when the biological samples need to be kept a specific temperature. We came back from Esrange with excellent feedback and precious help to boost the design for the next phase of the program. Honestly, this program is excellent! If you have the opportunity to participate in that program, DO IT! They expect us to develop high-quality experiments, we get to meet executives from different space agencies and space-related companies, we get to launch in an actual European Ground-based Station. This is just an exceptional opportunity for students all over Europe to gain incredible experience and insight into space mission development and operations. It is an astonishing amount of work, especially for a small team of seven like us. Still, the experience is gratifying, and we are preparing now for the Critical Design Review (CDR) this May at ESTEC in the Netherland again. After CDR, the design will be fixed, and we will start assembling and meticulously testing our system. A quick resume of the fun part: Esrange Space centre is beyond the Arctic Circle in Sweden, and it is beautiful! We have seen Aurora Borealis, learned how to do an Arctic tea party, skied at night around the balloon launch pad of the station, raced reindeers and enjoyed the food of the great canteen before relaxing in the sauna of the hotel. We told you, if you have the opportunity to participate in the REXUS/BEXUS program, don’t think twice.  An Arctic tea party from Adrien Bolliand and Aqeel Shamsul. The hot water instantly froze to make ice clouds.  BoB our C. elegans mascot wondering in front of the Royal palace at Stockholm.  The team with BoB and our train cabin mate at Boden. You can follow our adventures on Instagram https://www.instagram.com/bammsat_on_bexus/?hl=en and twitter https://twitter.com/bob_ze_wormnaut. If you want more information you can visit our website bammsat.com and contact us. Thanks to the sponsors of this program: REXUS/BEXUS student program, DLR, SNSA, ESA, SSC, ZRAM and MORABA The UK Space agency who are currently looking into helping us financially. Cranfield University with Professor David Cullen and the University of Exeter with Dr Tim Etheridge for funding and supporting us. BoB team: Aqeel Shamsul, Giovanni Sinclair, Adrien Bolliand, Mike Cook, Amin Chabi, Mateusz Zalasiewicz, Miguel Martinez De Bujo. |
| FROM Cranfield SOM Blogs: Creating a mailing list in FAME |
|
Did you know that FAME, one of our finance resources, also has the functionality to create mailing lists for British and Irish companies? This can be particularly useful if you need to produce a list of company contacts for research purposes. Read on to find out how. In order to define the companies you wish to contact in your mailing list you first need to build a search strategy within FAME. Companies can be selected using a number of criteria including location, industry sector, business description, financial data and even by number of employees. 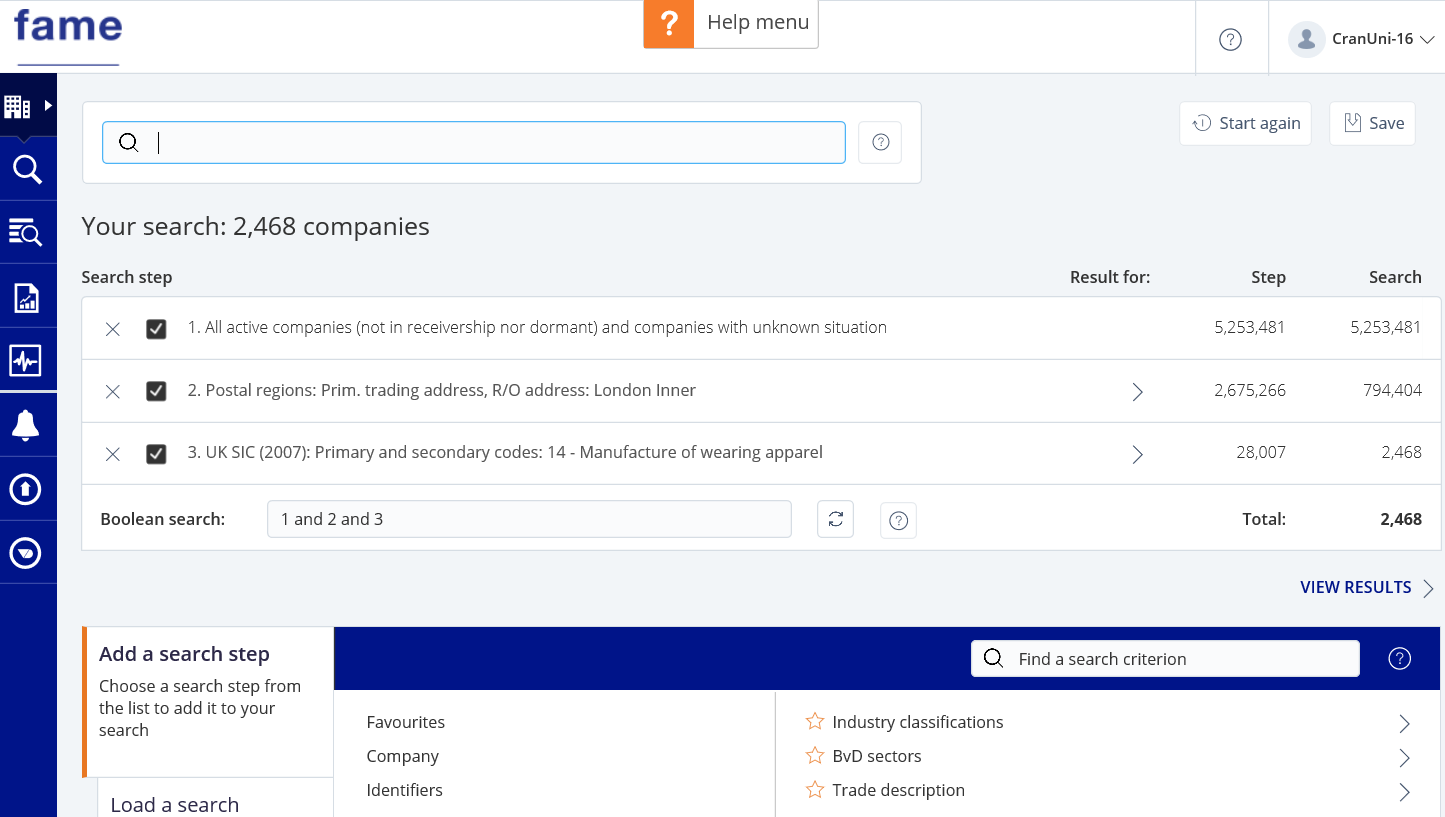 Building your search View the companies in your results first to check that you have chosen the correct criteria and amend as necessary. See our earlier blog post introducing FAME if you need more information. Once you have finalised your set of companies, select the ‘Tools’ icon on the left hand side menu and choose the Contact tool. 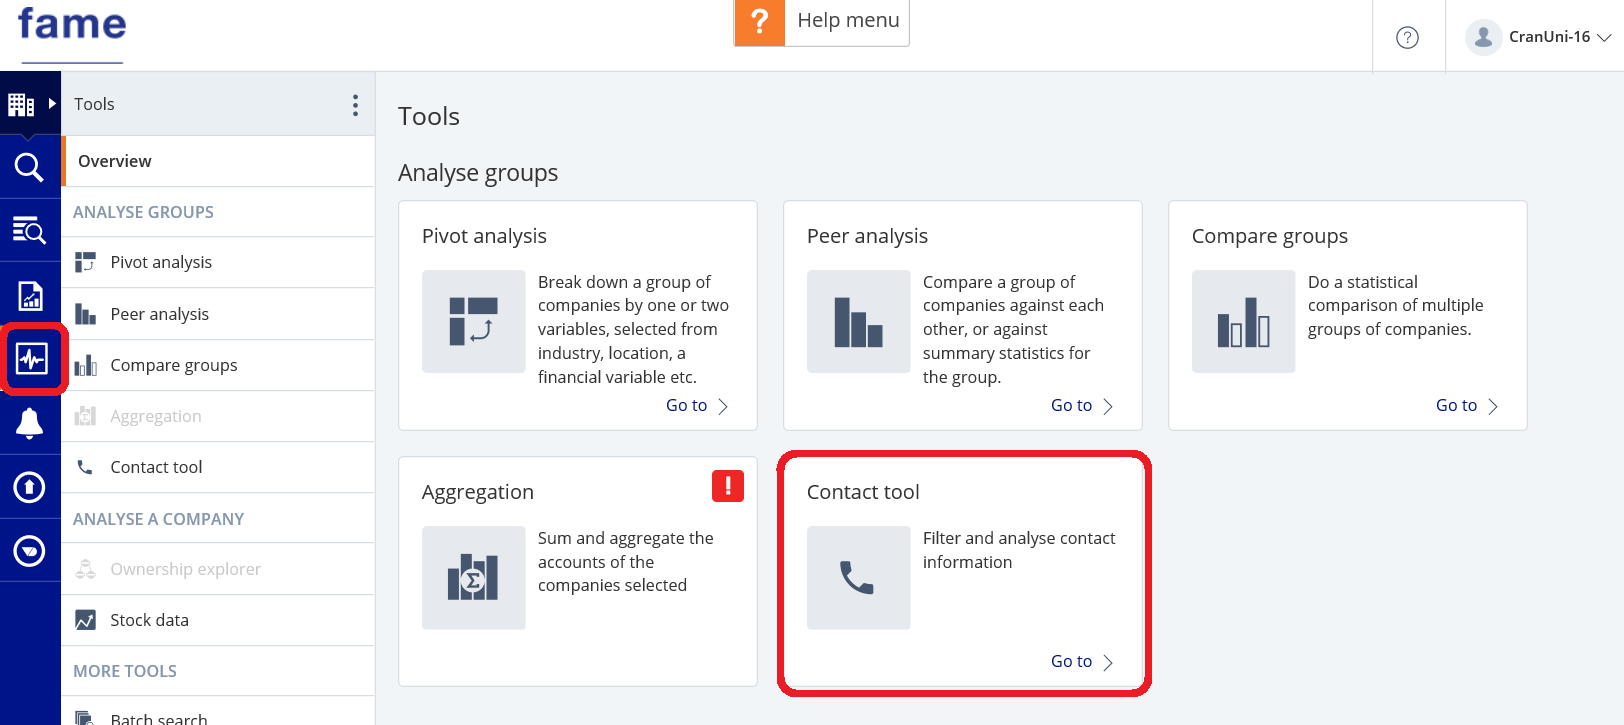 Opening the Contact tool Start creating your new ‘Contact Selection’ and you will be taken step by step through the process of creating a mailing list. You can choose who you wish to contact (i.e. their company role), the contact information you require (e.g. email, telephone, etc.) and any exclusions you may wish to apply. The mailing list will be generated and displayed on-screen. If required, columns can be added or removed before exporting. Once complete, the components of the mailing list can be exported to Excel. 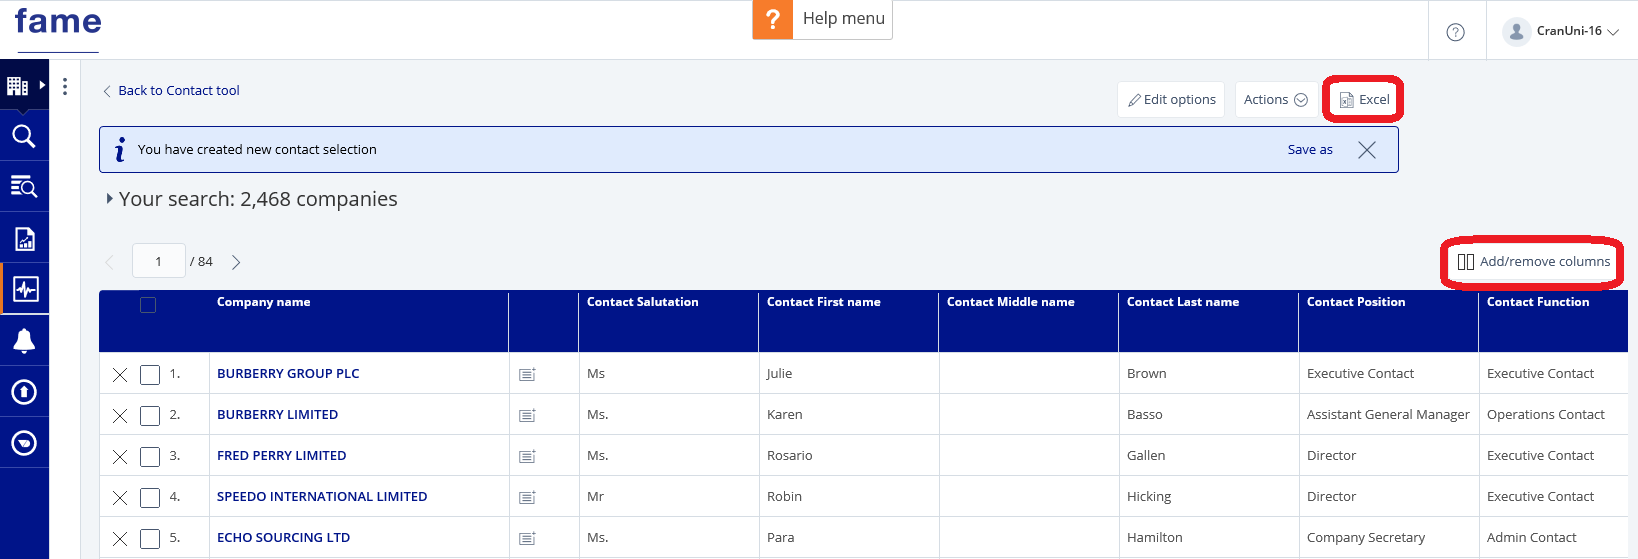 Exporting your mailing list Please note that before you use your mailing list to contact any of the companies you must comply with GDPR rules. All files must be first run against the University’s bulk mailer to exclude University contacts who have opted out of receiving emails. For any questions on Fame or other Library resources, please contact MIRC. For further advice and guidance on data protection, please contact your Data Protection Coordinator. More information can be found on the University’s General Data Protection Regulation intranet site or contact them by email onGDPR@cranfield.ac.uk. |
| FROM Cranfield SOM Blogs: Aerospace Materials MSc – delivering the future sustainable vision of aerospace |
|
The first month of the calendar year was a busy one for our Aerospace Materials MSc students, with exams, two teaching weeks and a private study week. Aerospace Materials MSc in focus January began with an interesting teaching week on “Materials Selection”. This involves working together in groups on a variety of design specifications, across a range of applications for aerospace through to automotive, using a recommended method to select and defend choices. Lots of discussion, followed by a week to work on a set problem in some depth, before the final, busy teaching week of “Surface Science and Engineering”. Surface ccience engineering is a specialism at Cranfield University, where we have a breadth of unique facilities and a long-standing track record of research with partners such as Rolls-Royce. This module allows us to consider how surface engineering may be used to optimise the performance of a range of components; coating systems on aero-engine turbine blades are great examples, developed in collaboration with Rolls-Royce. We address a range of methods of depositing coatings, suitable analytical techniques to evaluate surfaces and how to assess performance in application such as friction, wear, aqueous corrosion and high temperature oxidation. The start of February, with the taught element of the course completed, our students started the first of two research project opportunities. They met in their new, small, project teams to address the many industry design problems and research challenges that have been set for the groups. This experience is highly valued by both students and prospective employers. With support from external organisations, the findings will be presented to industry in 12 weeks which is a very exciting time for our students. “The research part of the MSc greatly exceeded what I expected. Both the group and the individual projects were invaluably enriching experiences, and the main reason I decided to come back to undertake an EngD,” says Koldo Amandoz Forcén who graduated from the Aerospace Materials MSc course in 2017. Aerospace materials enabling sustainable aviation Never before has there been such a need for specialist engineers with a deep understanding of aerospace materials. There is a real demand for innovative thinkers to address environmental impact and sustainability with the sector to enable the next-generation aircraft and future aerospace. We continually review our course content and equipment to ensure our graduates have the skills needed to meet the future challenges. Cranfield University is committed to support of materials research and has recently invested £1.6M in renewal of the ‘Electron Microscopy Suite’, part of our materials characterisation facilities. Students took part in introductory lectures last month, focused on a range of techniques and will use these new facilities to support their group design projects and later in their own individual research projects in the spring. We look forward to our students completing their MSc course and seeing them develop material technologies to deliver the future sustainable vision of aerospace. For more information or to apply for this MSc, please visit the Aerospace Materials MSc course page. Dr Sue Impey, Course Director, Aerospace Materials MSc MSc Programme Director: Manufacturing Technology and Materials |
| FROM Cranfield SOM Blogs: Antarctica, Cranfield and beyond |
You may already know that Martin Davey, our Cranfield Student Association General Manager is retiring soon from his position. I thought that he may have a lot to say about how Cranfield has changed during the last 10 years he has been working here and I am sure we all have a lot to learn from his experience and view. Martin, tell us about your background, what did you used to do when you were younger? I used to work in Antarctica, I did that from 1986 until 2001. How did that happen? I started as a scientist, biologist, went there to work with plants, then drifted into more support services. I first went there for 18 months then got back for some time. I later returned for two and a half years; I also went to the Artic. There was a lot of travelling involved. What did you work on? I worked on algae and mosses, very small plants basically, streams and ponds and wet patches. Where did you study to end up there? I studied in Edinburgh and later I did a postdoc in Bristol and finally ended up in Cambridge Antarctic institute. When and why did you begin working at Cranfield? It was in middle October of 2010. I had done the same job at the University of Luton, later named University of Bedfordshire, for 10 years. I came for a job in Cranfield in education services, I didn’t get it, but I was suggested this job, I applied and got it. It would have been more routine to do the other job; I wouldn’t have been that good at it. How have you changed through your years at Cranfield? Not that much, I learnt a few new things along the way, but I had already done this job. The thing is that Cranfield is different from Luton in terms of demographics, students here are postgraduate, so they are older, presidents are older, and there are different backgrounds. In Luton they had different expectations, they were younger, and they were more focused on social issues, here you are more focused on wider issues like bus service or accommodation. What is the best thing about Cranfield? It’s the people you work with. How have the students in Cranfield changed through the years? We used to have more British students, lots of European but over years Cranfield has got more intercontinental, Nigerians, Indians, Chinese. Demography changes, visa regulations changes, now we have more families on campus for example, we didn’t use to have that. The students also have more work to do in their masters than they did 10 years ago. How was the past of Cranfield? It was not this pleasant, bus system has improved a lot, it is a great service compared to what it was, shops are much better, lecturing facilities have improved a lot. The vice-chancellor emphasis on that, massive buildings going on for research purposes, that is all positive. Has the weather always been like this? There was no snow this year. Climate change maybe, during the summer we get a pleasant campus, with a lot of open space, far better than Luton. It will rain but it will be warm. Do you have any message for the students? Enjoy yourselves, if you are enjoying life, get the most out of it, you will enjoy your work, don’t count the days, make the most of every opportunity. Stay in touch with people, make contacts, make the most friends. Do you have any plans for retirement? Travel a bit in the UK and abroad, work on the house and garden, participate in the social life in the village, I want to get involved. When you change jobs, it’s the right time to move on. I don’t feel old, there is nothing I can’t do, so it’s good to retire, when you can still do everything. I have a family of long living people, so I hope to have a long and enjoyable retirement. |
| FROM Cranfield SOM Blogs: How often do we use robots? |
|
How often do we use robots, will collaborative/companion robots with better Human Robot Interactions change the world? My name is Raviteja Burugu, I am from India and I am studying an MSc in Robotics at Cranfield University. Hope you have read my previous blog about my experience of studying an MSc in Robotics. If not have a look here. In this blog I am covering an interesting aspect about Robot design. Robots are everywhere these days performing activities ranging from cleaning the floor to performing tasks on Mars, assembling small components to assembling another robot. Humans are required to control these intelligent agents/robots, thereby interactions between human and robot is very common these days. However, what are factors that we need to consider while designing a robot that interacts with humans? How can we increase the adequacy of robots among humans? Does the size of robots intimidate humans? Does the speed of the robot have any effect on usage, or should the robot have the best technology with best user interface? I had many questions like this before joining the Robotics Masters at Cranfield University. After taking modules related to human-robot interactions (HRI), and psychology ethics and standards of robots. I was able to answers many of these questions. This led to a development of immense interest to study more about human-robot interactions and psychology aspects of robots.  Major Domains of Robotics. (I will try and cover all these topics in one blog in future!!) The world is moving towards automation, Companies around the world are developing robots for various domains as shown in figure 1. However, not all developed robots are successful, even though their technical abilities are very high. In my opinion, human-robot interaction is one of the key factors that determine the success of the robot. HRI is multidisciplinary in nature. The figure below illustrates the vastness of the subject. 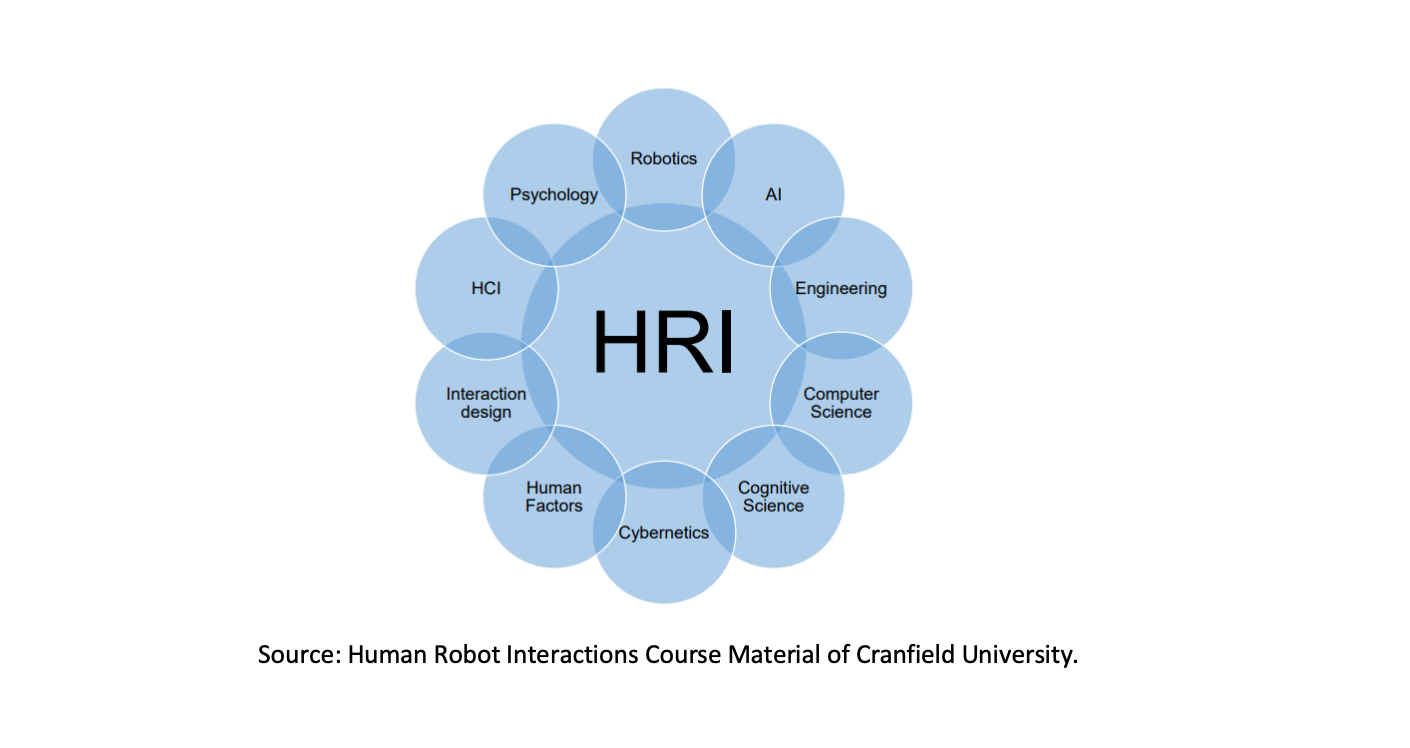 Are you thinking what HRI is? How do we use HRI to make a robot? If it is something new? What do we need to do with HRI to make a robot? I can probably say it is a newly developing branch (since early 2000) of Robotics. It addresses the understanding, design and evaluation process of robotics systems that involve humans and robots interactions through communication. The goal of HRI is to achieve a more natural and effective interaction between humans and robots. Expectations of human, psychological parameters, ethics and standards will drive the design and development of the robot by studying the HRI. HCI (human-computer interaction) is another field of study of how people interact with computers and to what extent computers are or are not developed for successful interaction with human beings. HCI is being studied quite extensively but the metrics and tools are not transferring completely to HRI. Having said that, HRI is different from HCI but HCI is one of the factor while developing a robot using HRI principles. So, let us try to create a robot, say a Campus Guide Robot. The first step of the HRI system would be defining the problem. Step-1 – Problem Statement: It is always difficult to find a way if we are in a new place. We often use Google Maps to drive from one place to another, even though we reach our destination, we will not have enough information about where to park the car or which would be the best path to reach the desired building. When it comes to universities, which are quite vast. We have seen (and not only during the first days) many students or visitors searching for a building, having a lot of questions about when, where or for how long an event or lecture plans on that particular day take place. Step-2 – 5W 1H Analysis of the problem: 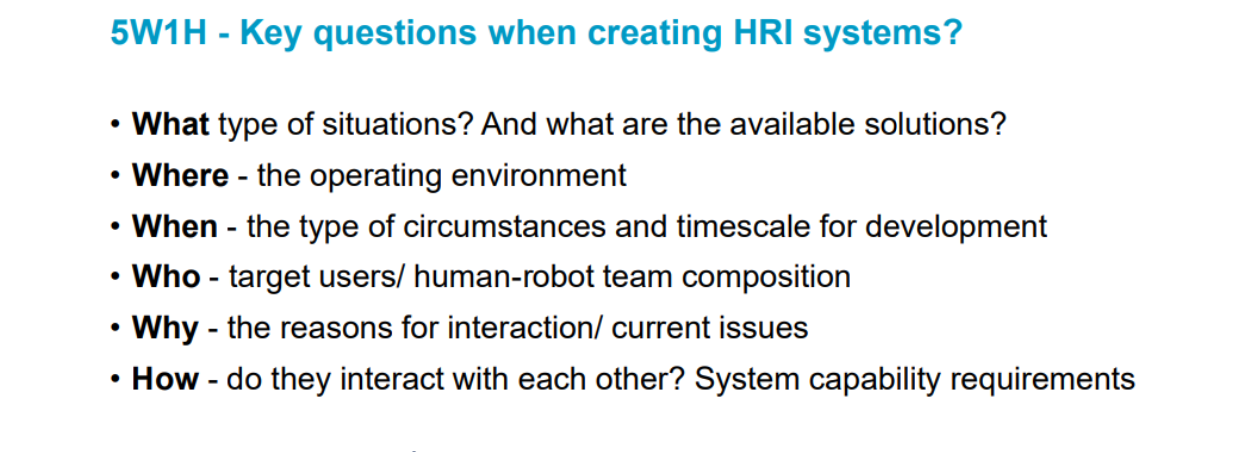  To elaborate on the analysis: What? Our problem statement speaks about the situation; there will be many direction signs, notice boards and volunteers helping, are the available solutions. Where? The operating environment would be on campus, we have considered the challenges we will face while installation and during the use of the robot. When? We need to operate it 24*7, 365 days, here it would be challenging, we need to think about the security, weather conditions, maintenance and safety. Who? As the HRI systems goal is to develop a robot that can be best suitable for usage, we need to understand the range of audience, how much autonomy of robot they would be interested so on. Why? The first statement would be saving the time, making life easy and we have to understand the current challenges like using the signboards etc. How? An interactive interface that shows paths to the destination, answers to the questions using AI. “Every question require a lot of consideration but it gets progressively easier as more questions are answered.”? Isn’t it Interesting? It is just the beginning of the processes we have a few more steps to follow I would like to continue it in the next blog. Thanks for reading the blog. |
| FROM Cranfield SOM Blogs: Performance Reporting Measures vs Performance Management Measures – Part 6 of 6 |
|
You may have read my previous blogs comparing Performance Reporting Measures vs Performance Management Measures. Performance reporting is littered with measures that may appear to carry meaning for some people, but in our observations, have been misleading and impenetrable to many. And certainly don’t help understanding nor how to improve! Here are some examples of reporting measures that we introduced previously:
This week we’ll look at the statistical representation of a population such as Electric Car Use by Country, Knife Crime by London Borough, incidence of cancer in patients over 70 by county and so on. Here’s an example of how Electric Car Use by Country looks: 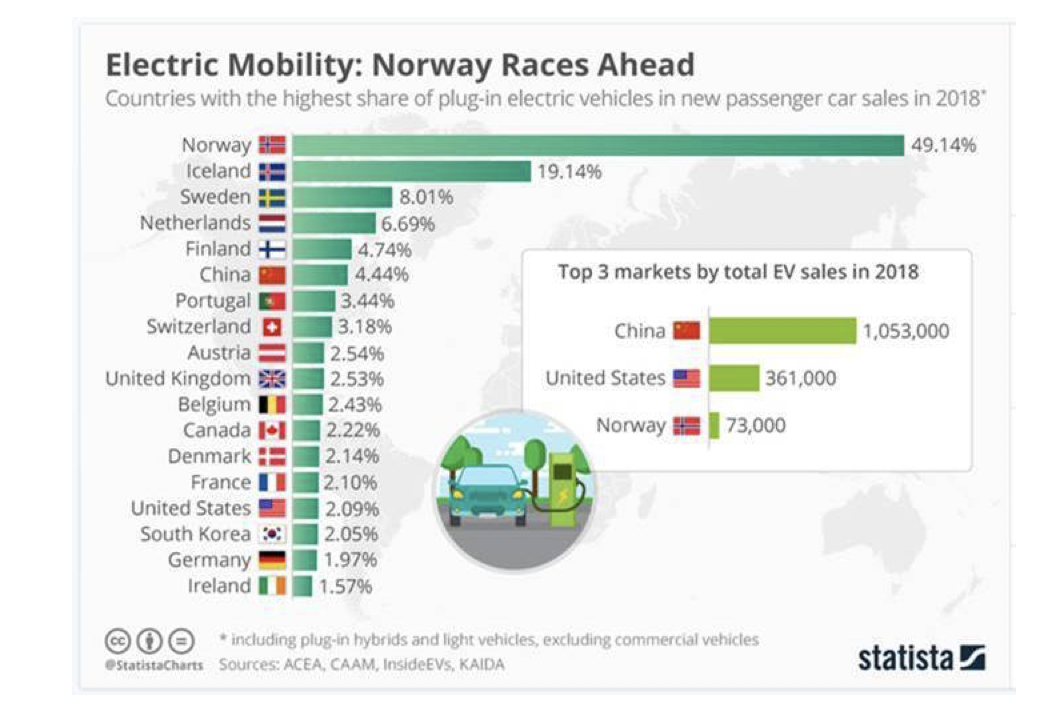 There is nothing wrong with this measure, nor the way it is represented in the chart. However, this chart does nothing to assist the understanding of how quickly each country has reached its certain percentage above, nor if it’s going up or down, impact (if any) of government incentives or social pressures or what is likely to happen in the future. What is missing is the time dimension. And rather than switching to a more appropriate chart to aid understanding, determine potential drivers, and look for improvement, we often get hit with bastardised diagrams such as the one below: 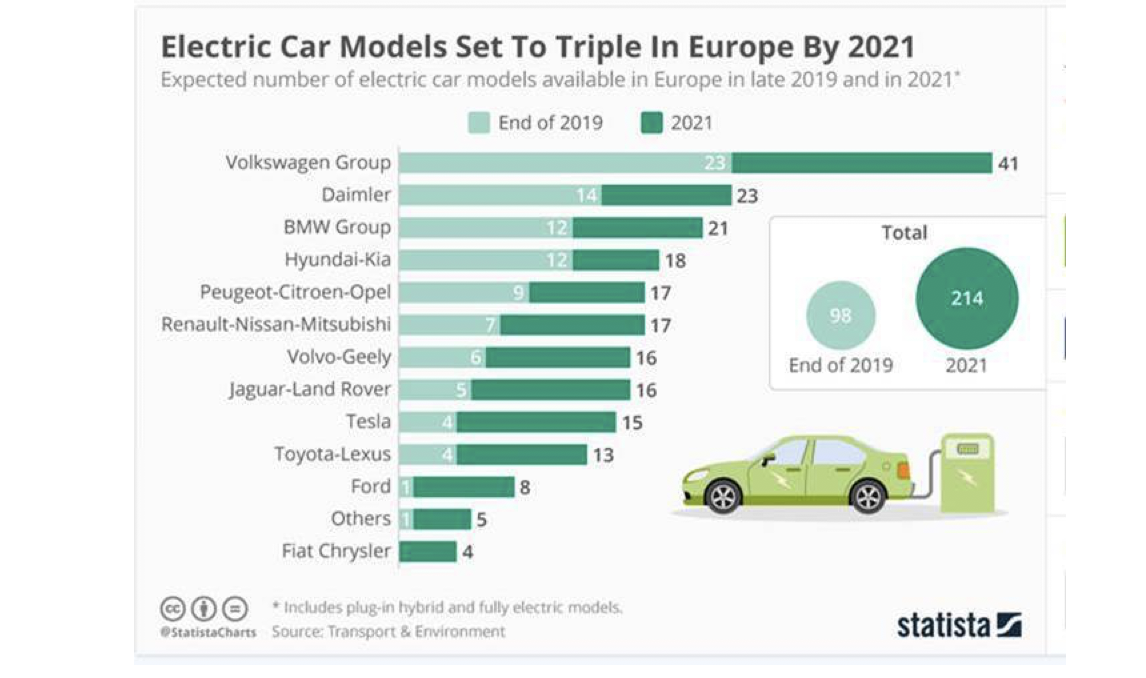 Which serves up binary comparison (result for one period vs result for another period) – and we’ve blogged about the dangers of binary comparisons in the past – in this case the population by Manufacturer of the no. of electric models in 2019 vs 2021. But going back to Norway, where everyone is getting excited about government aims of zero emissions by 2025, we can see a reasonable representation of the growth of Electric Vehicles over time using a bar chart rather than a time-series chart. We can clearly see how electric vehicles are taking off. And it looks like it started in 2011. 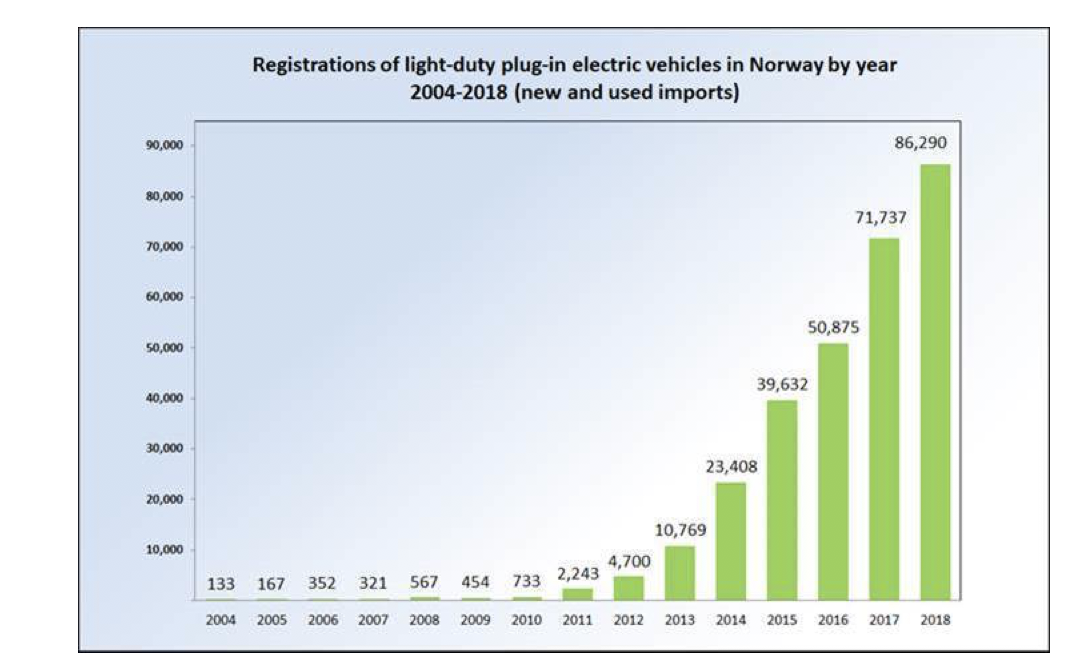 BUT! It is very difficult to see if the increase is still accelerating, or starting to flatten off and if it is flattening off, when and why? Another problem with looking only at annual figures in this way is the impact of efforts by the Norwegian government to drive EV take up. There were apparently incentives in the 1990’s but obviously then finding an electric vehicle was rather difficult! These incentives included EVs being exempt from things like Purchase Tax and VAT, and these incentives were extended in 2015. EVs can travel in bus lanes, and can access free parking in cities. The government is now considering removing some of these incentives. It is not at all easy to see when these incentives made an impact on sales figures, nor what may happen if they are removed! Looking at these figures in a time-series chart, the interesting story is that since 2013 the increase in EV sales is about 15,252 per year, with the sales in 2018 reaching 86,290. And now we can “forecast” forward to 2025 when the government has stated zero emissions only. 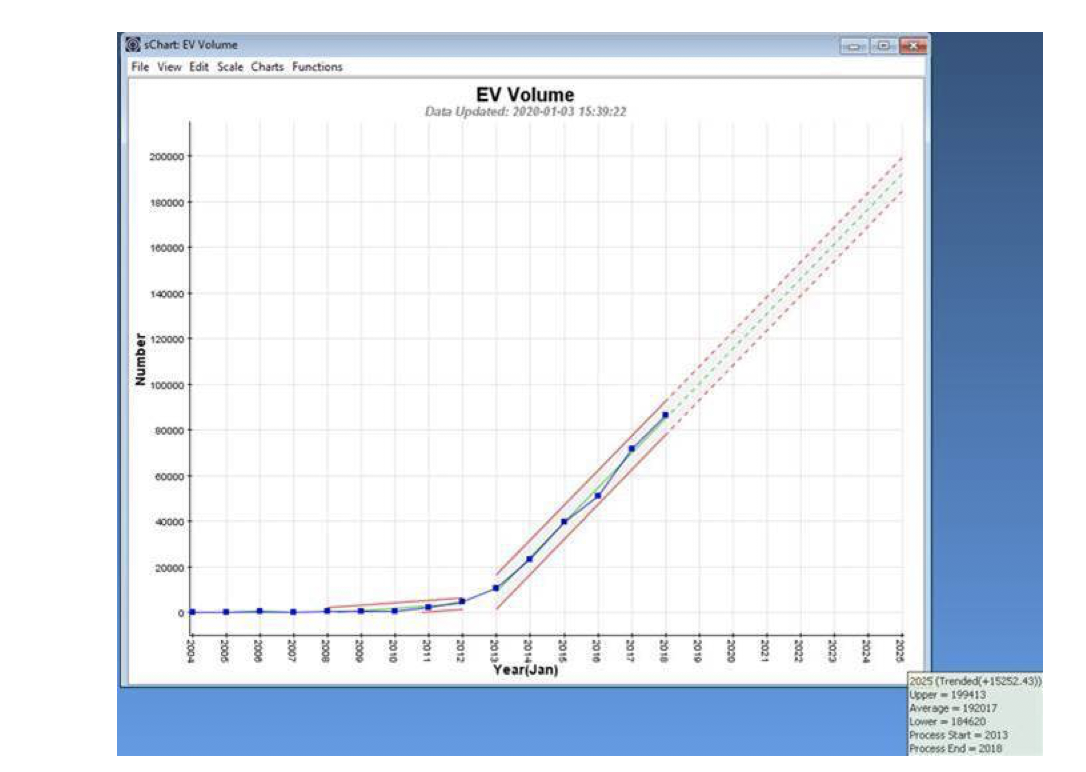 By the end of 2018 a total of 300,000 EVs are on the road, and if the trend continues, by 2025 over 1.3m EVs will be roaming Norway. But the government is looking to remove EV incentives imminently. The time-series chart will be the more sensitive in visualising what impact this may have on EV sales. And we do talk about presenting figures in context, so not to flatten all the excitement around EVs in Norway, here’s the population breakdown of vehicle types in Norway at the end of first calendar quarter of 2019. 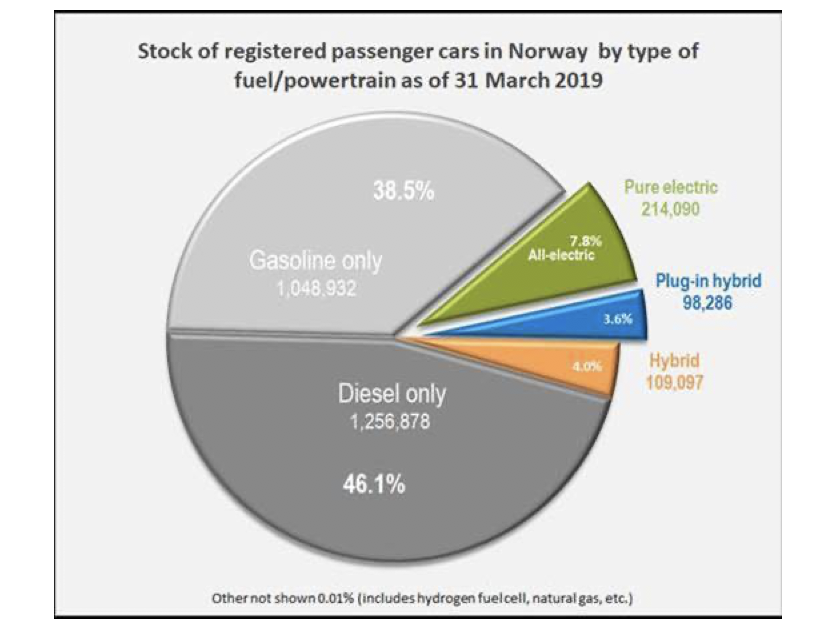 So, approximately 300,000 EVs in a total population of passenger vehicles of 2.7m (11%) at the start of 2019. The time-series chart above projects that by the end of 2025 there will be around 1.9m EVs on the road. But it is difficult to get figures about the overall increase in demand for passenger vehicles as a whole, and about the projected growth of gasoline and diesel passenger vehicles in particular! So, zero emissions by 2025 is a great aim, but in practicality it looks a little bit of a challenge to me! In summary, population distributions are fine as far as they go, but without a sense of time, they are of little use in understanding system and process behaviour, or how to effectively go about system and process improvement. Put them together with context and time – that would keep Dilbert happy! |
| FROM Cranfield SOM Blogs: Setting up a private group on Mendeley to support your group project |
|
Many of our students are busy working on their group projects. Our top tip is to set up a private group on Mendeley. You can use it to store all your references, and to share the full text of PDF documents with other members. As well as downloading them, your group will be able to work directly on the same papers online at the same time, highlighting and annotating them to support your project. Individual comments will also show who made them and when they were made, to help you make sense of the notes. Until recently Mendeley account users could only set up a private group with up to three people. Elsevier have now increased the membership to 25 which is helpful for your group work! Getting started Find out more about setting up a private group on Mendeley (Mendeley support site) Watch the short video tutorial (YouTube) Visit our own Mendeley help pages (University intranet) Tips Only one member of the project group needs to create the private Mendeley group. We have heard it is best that you wait until everyone has joined the group before you start adding documents to it. If your group size appears to be restricted, it may be because the current owner of the group does not have enough available storage space. Mendeley has also confirmed that you need to add a PDF file to the group area before you start annotating it. If you annotate it in your own account before you share it, none of the other members of your group will be able to see your notes. And of course, don’t forget that your Information Specialist is more than happy to help you find relevant information for your project, as well as supporting your use of Mendeley, if you need them! Good luck!! |
| FROM Cranfield SOM Blogs: Research data – what to keep? |
|
Deciding what research data to keep, and why, has become a more significant focus in recent years as the volume and diversity of data outputs have grown. The What to Keep study was commissioned by Jisc and undertaken from May 2018 to January 2019. Among the key findings from the study are:
Some questions remain around what to keep in relation to instrumentation data, outputs from models and simulations, serendipity and “Curated Databases”. Regarding supplementary data and materials, we should keep metadata, some software/algorithms/codes supporting data reproduction or interpretation, and physical materials. The CESSDA SaW Cost Benefit Advocacy Toolkit provides valuable tools for thinking about future cost and benefits of research data. Photo by Adam Nowakowski on Unsplash |
| FROM Cranfield SOM Blogs: Gender equality isn’t just for women – it’s for everyone |
|
“Sometimes if we only talk about women’s working needs, confidence or leadership, the attention turns to the woman and turns away from the rest of the organisation – including the men.” Dr Doyin Atewologun, Director of the Gender, Leadership and Inclusion Centre, opened Cranfield University’s International Women’s Day event with this call for everyone to be allies in striving for gender equality. With the theme of #EachForEqual, Cranfield’s panel debate in front of over 90 people was a lively discussion of organisational culture and personal experiences. Hiran Odedra, Head of Diversity and Inclusion, Duncan Murray, Director of Communications and External Affairs, and Caroline Carter, Council Member and former lawyer, took part – and here’s five key points I drew from the event: Don’t look for obstacles Caroline Carter was a trailblazer within her law firm, being the first partner to have a child, and said: “If people offer you a helping hand, take it. Don’t look for obstacles, there are ways through challenges. I tried not to take offence and was prepared to carry people with me. By making friends along the way, and not enemies, you can change culture from within.” Duncan Murray spoke about how you can learn along your career path: “In a previous role my boss was an impressive woman, and I learnt a lot from her about establishing an open culture where people can speak their mind and challenge you. You need to take the best bits as you go along your career.” Diversity should be a way of life “Diversity always has to be on the table,” said Caroline. “You have to be thinking about it if you want to create the best and most competitive workplace. To make real change, you have to get up every day and think about how you’re going to make a difference – can you help someone, guide someone or challenge someone? With a collaborative mindset, where people can work with anyone and everyone, you have a better organisation.” And Hiran Odedra agreed: “By creating a diverse workforce, you’re naturally going to have a more inclusive organisation. Where people are valued and treated fairly, you will get more productivity. Organisations with an inclusive culture retain staff and attract talent.” Set a target then work out how to get there Duncan drew inspiration from JFK who became President of the USA and pledged to get a man on the moon by the end of the decade. NASA achieved it with six months to spare. “At the time he [JFK] said it, they didn’t know how they’d get there. They set an ambitious target then worked out how to reach it, and I like that as a strategy.” With Accenture pledging to have a 50/50 gender balance in their workforce by 2025, and Vodafone aiming to be the best employer in the world for women by 2025, it’s clear that some organisations also embrace this approach – I’ll be following their progress closely in the next five years! Call out behaviours that aren’t acceptable Hiran recalled walking out of a meeting with a recruitment consultant when her ethnicity was mooted as a factor in her not getting a role. She encouraged everyone to call out inappropriate behaviours, noting, “you can do this by talking about the impact it has had on you. When I was leading a working group it was assumed I was the secretary – I had to point out that I was chairing the meeting. At the end, I spoke to the person concerned and told him how it had made me feel.” Caroline noted that none of us are immune to mistakes, sharing a personal example, and Doyin suggested we acknowledge an issue, and “be gentle with yourselves.” She continued, “We could all be culpable. Reflect, if needed, in your mind, or with your team – what can you learn from it even if the moment has passed?” Can you challenge your own mindset, and that of others? Doyin urged us to challenge our own assumptions that reinforce an ‘us versus them’ culture. It’s easy to assume that older people have a closed outlook on diversity, for instance – but this might not be the case. If people have an open mindset, no matter what their age, gender, creed or background, then change can happen. So it’s vital to tackle values, outlook, behaviours and mindset – both within ourselves and in others, even if it’s difficult. We all have a role to play in #EachforEqual – and there’s a lot we can achieve if we work together. Let’s be brave. |
| FROM Cranfield SOM Blogs: Charting data in FitchConnect |
|
FitchConnect users, have you tried out the charting function? In case you don’t know… in addition to its country and industry reports, just like its predecessor BMI Research, FitchConnect includes a huge data bank of macroeconomic and industry data, available for download and manipulation. Here, to demonstrate how easy it is, we will chart the GDP per capita for the last 10 years for the MINT countries: Mexico, Indonesia, Nigeria and Turkey. For comparison purposes we will opt to display the data in US$. Getting started: To begin, select the ‘Interactive Charts’ option from the ‘DataTools’ menu. 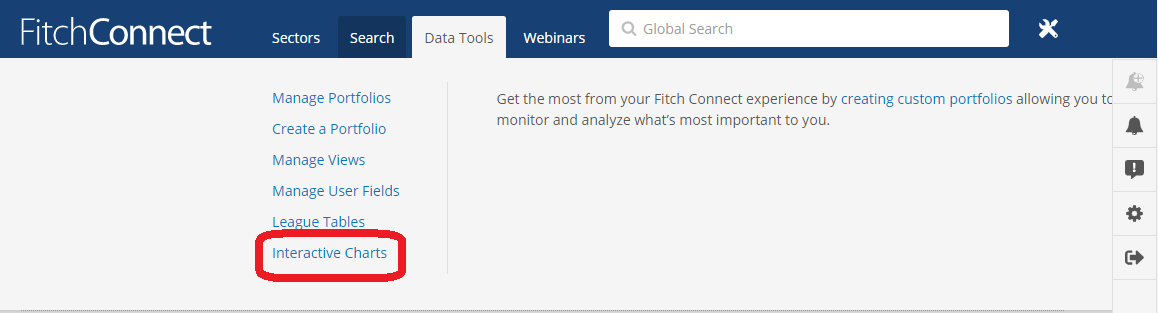 Accessing the Charts menu Selecting your data is an easy 4-step process using the arrow buttons at the top. You can download raw data to Excel or display it as a chart or table. Step 1: Select your Geography: Select the country or countries you require from the ‘Select Entities / Geographies’ options. Within Geographies you can either browse by continent using the > icons or search using the ‘Find regions’ box. 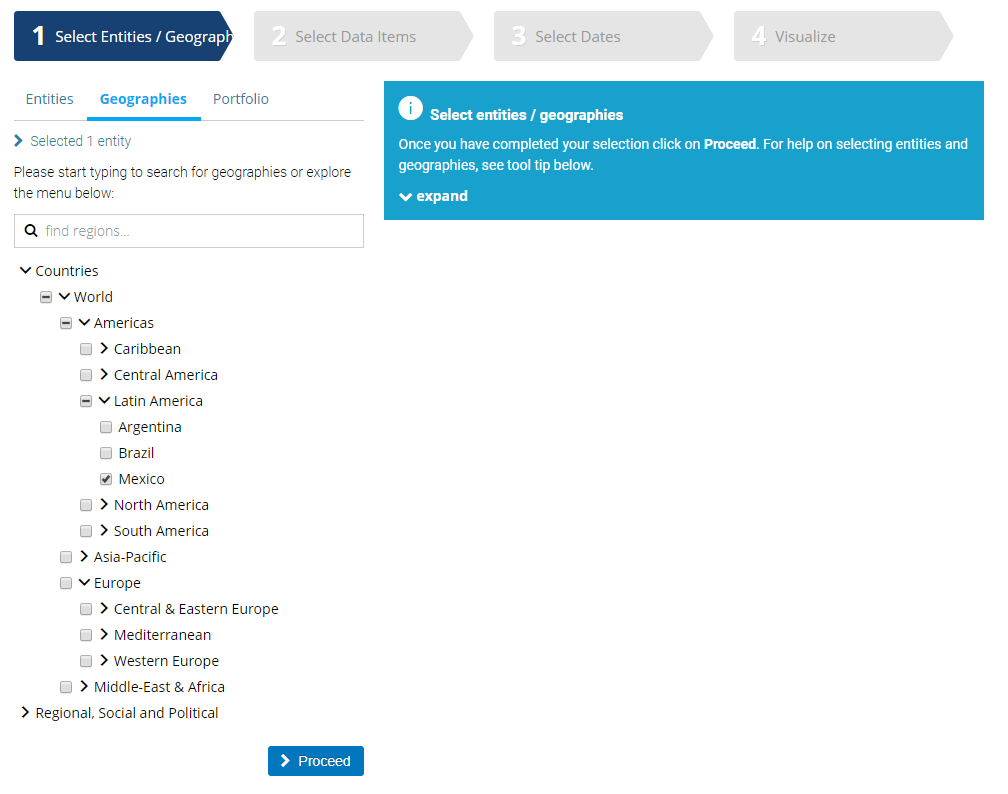 Remember to select each of the countries you require using the check-boxes. Click ‘Proceed’ to move to the next step. A tick should now be displayed on the Entities button. Step 2: Select your Indicator(s): Now click on ‘Select Data Items’ to select the specific data you want to use. BMI contains a databank of more than 1.6 million lines of data covering both industrial markets and macroeconomic data. For GDP, we will need the ‘Macro Economic’ menu. Open it using the > icon next to the title. Wherever you see the > icon, you can open further sub-menus to drill further into the data. If you are unsure of where to find the data items you require, search for them using the ‘Find data items’ box. 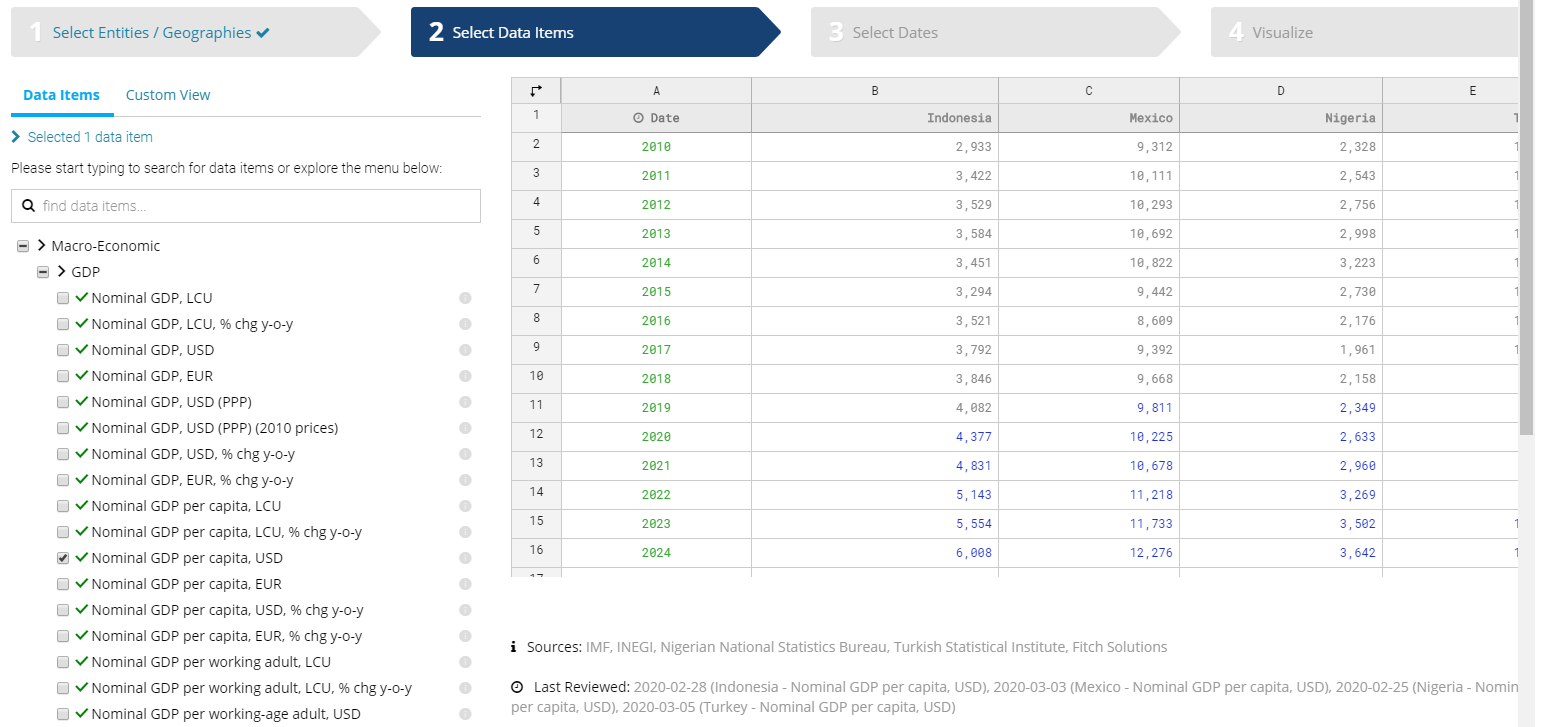 Remember to select each dataset that you require. Click on ‘Proceed’ the the bottom of your screen to move on. Step 3: Select Date Ranges: Select your data range and frequency. Data may be reported monthly, quarterly or annually. Be aware that most data is only reported on an annual basis. Depending on the datasets you have selected, your options here may vary. 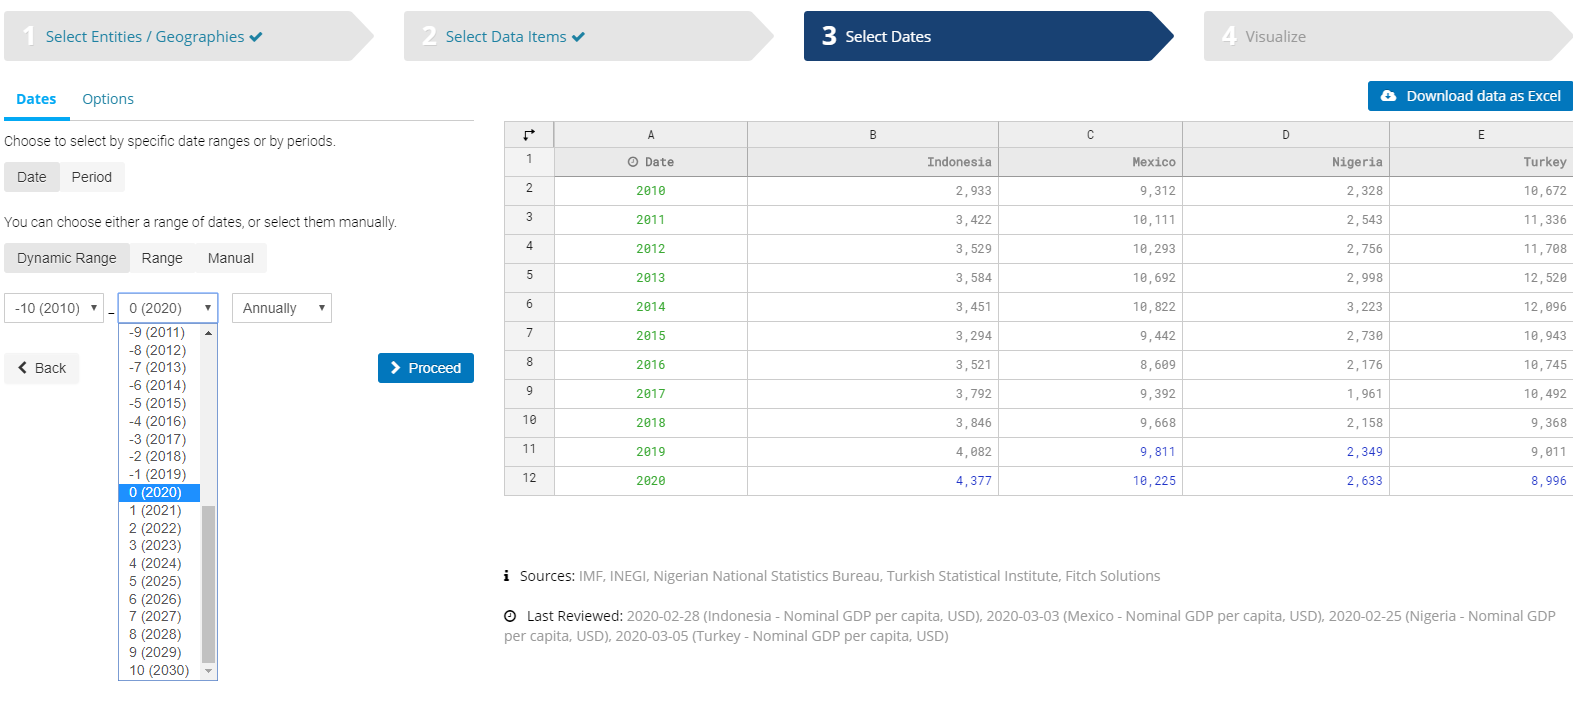 Use the menus to select your date range and frequency From here, download data directly to Excel via the button at the top right. Step 4: Visualise your data: Ignore the left hand side if you are downloading macroeconomic data and click on ‘Proceed’. (FitchConnect also provides finanical data which is not part of our subscription). 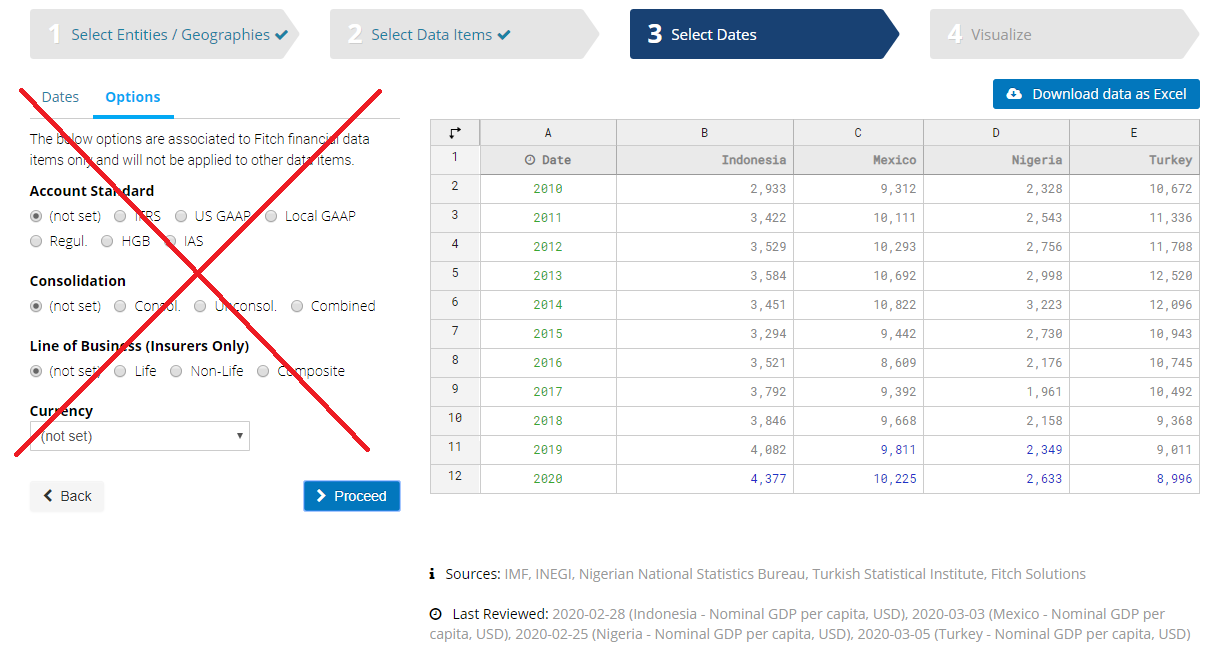 Click on ‘Proceed’ to move on. Select your chart format. We have chosen a line chart here. Click on ‘Refine’ and ‘Annotate’ on the left to make any changes you require – including colours, labelling, axes, etc. View your data in different chart formats to select the best. 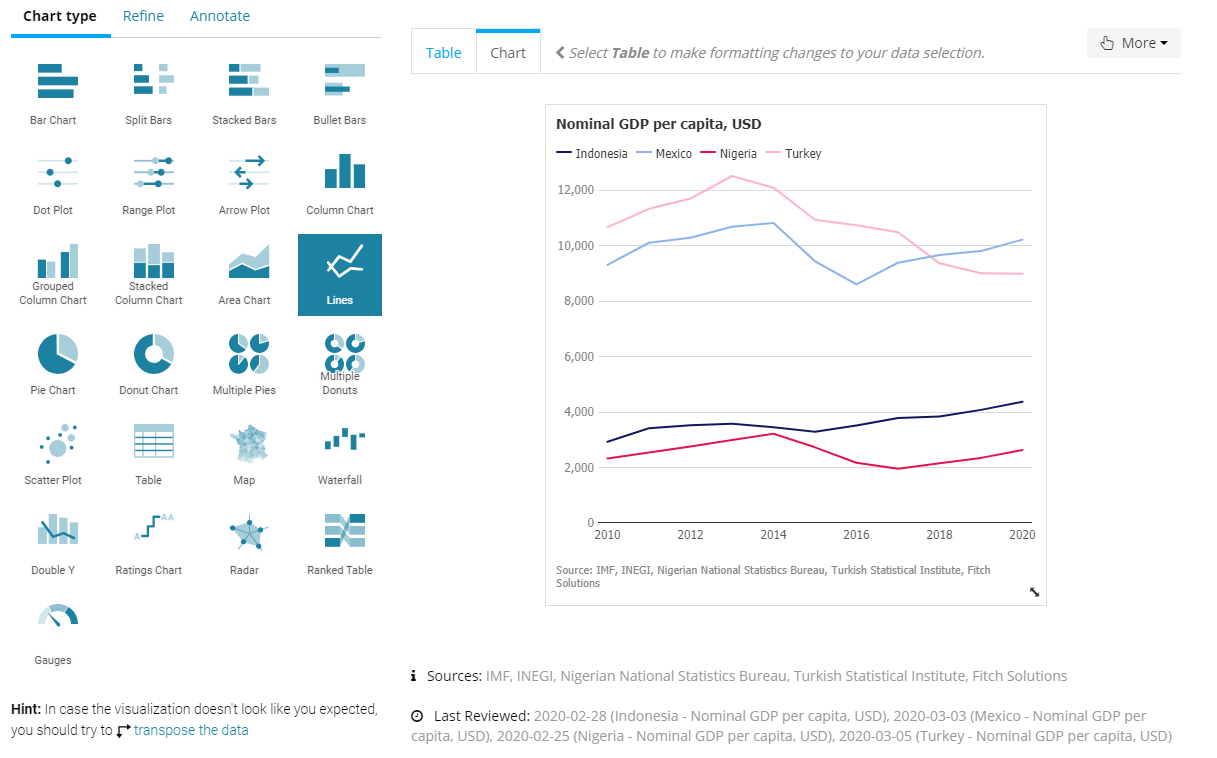 Make any additional changes you require then click on ‘More’ at the top right to save your chart and/or table as an image file. 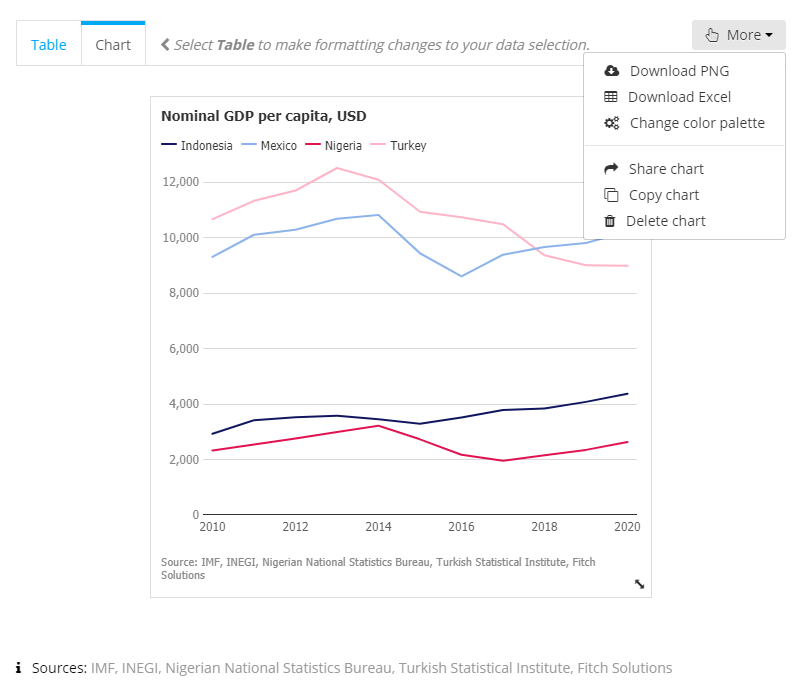 Download your chart If you are interested in downloading and charting data, you may also want to read our post on Finding economic data in Passport. If you have any questions about downloading data or charting within our resources, feel free to contact MIRC or the Kings Norton Library. |
| FROM Cranfield SOM Blogs: Library resource trial: Statista |
|
The Library Service has organised trial access to Statista until 30 April. This global business data platform provides insights and facts about 600 industries across 50+ countries. It also includes the Statista Global Consumer Survey which offers a global perspective on consumption and media usage, covering the offline and online world of the consumer. It is designed to help marketers, planners and product managers understand consumer behaviour and consumer interactions with brands. You will need to log in with your Cranfield network username and password to access the trial. AccessStatista now Tell us what you think! It’s important that you let us know what you think of the trial when you have used it. Your feedback will help inform our decisions about whether to subscribe to the resource. Please email us with your opinions or questions: libraryresources@cranfield.ac.uk. |
| FROM Cranfield SOM Blogs: Failing to Plan, Planning to Fail |
|
Failing to Plan, Planning to Fail Planning isn’t all about what we want to achieve. The biggest problem is actually implementing something that can be achieved and in a way that this will deliver the outcomes and benefits we want. For some things we can immediately see that the world is complex. Solving world hunger or stopping climate change are two examples of desired outcomes we would all agree are extremely difficult to deliver. But this is also true of smaller projects. How many times have we thought a simple process or system modification will deliver the change we require? Then what happens? We find that we have not truly understood the process or system we are interfering with. We find that others have a different view of what is best and a different view of how this can be achieved. Suddenly a supposedly simple project starts to hit the buffers and we are have to back track, re-engage with people and re-launch our project. So, if you are about to make an announcement about a change that is going to be implemented, just think again before you do it. The change may be a “Grand Challenge” and that is fine as long as you acknowledge that you don’t know how it is to be delivered and are making the announcement to engage others in the process. The change may be a new policy or strategy, but if you announce this without knowing how it will be delivered and if you haven’t planned the execution, then be prepared for a rocky ride. Announcing something to be delivered by a certain date and within a certain budget makes a great headline as long as you are not planning to be around to be held accountable for the results. |
| FROM Cranfield SOM Blogs: 19 March – REF update (webinar) |
|
Thursday 19 March, 1-2pm This is your opportunity to speak to our REF manager Andrew Kirchner and check you are in good condition for REF2021. The webinar is open to any Cranfield staff member or student interested in research. You will be able to access the webinar both on and off campus, but you will need to book a place through the DATES system on the intranet. Once you have booked, you will be sent a Webex link for your chosen session. We’ll also send you a reminder shortly before the session. Look out for the emails! Book now This forms part of a series of monthly webinars covering topics such as Open Access, setting up an ORCID, and using CORD. Find out about future sessions. Image fromthe REF2021 website |
| FROM Cranfield SOM Blogs: Where can I find out about country stability and risk? |
|
If you need to know about country stability and risk, there are two MIRC services you ought to be looking at: Bloomberg and FitchConnect. Bloomberg: On-campus users may also wish to look at Bloomberg, accessible in the MIRC Bloomberg Suite. The Bloomberg Crisis Monitor <CRIS> is the page to start from. The Crisis Monitor brings together economic and market data related to financial or political crises in three areas of the world – Europe (our default view), the Middle East and the United States. 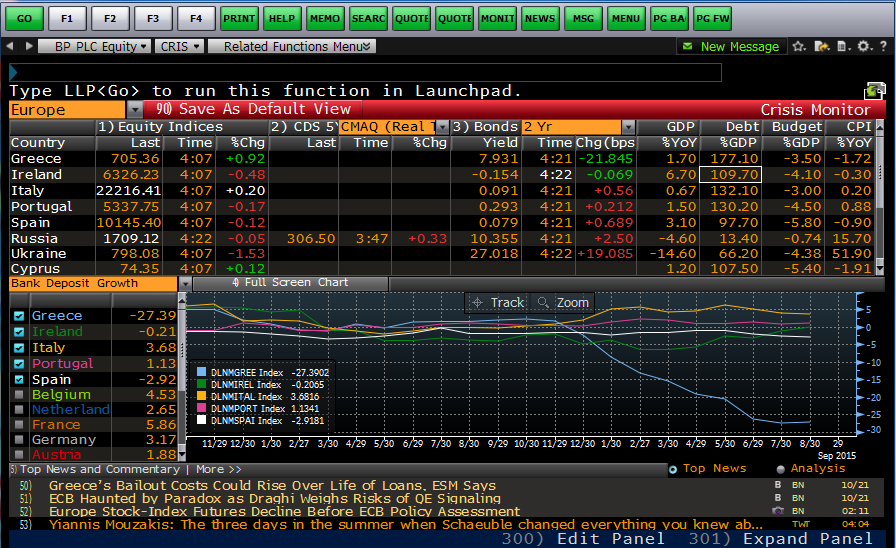 Bloomberg’s Crisis monitor Switch between regional screens using the orange drop-down menu at the top left. Data varies for each region but gives an overview of major markets affecting the economies – including equity, bond and credit – alongside access to various key economic indicators and news items essential to review the relative financial health of a country and its likelihood of default on its debts. FitchConnect: FitchConnect covers country stability and risk in its aptly named Country Risk Reports which it publishes quarterly for roughly 200 nations.  Country Risk Report from FitchConnect If it’s rankings or data that you’re looking for, access these from the ‘Sectors’ > ‘Country Risk’ menu option. From the Country Risk page, you will find country analysis and reports, but also the Fitch Country Risk Index which provides a country-comparative evaluation of the political, economic and operational risks to stability over a short- and long-term time horizon. 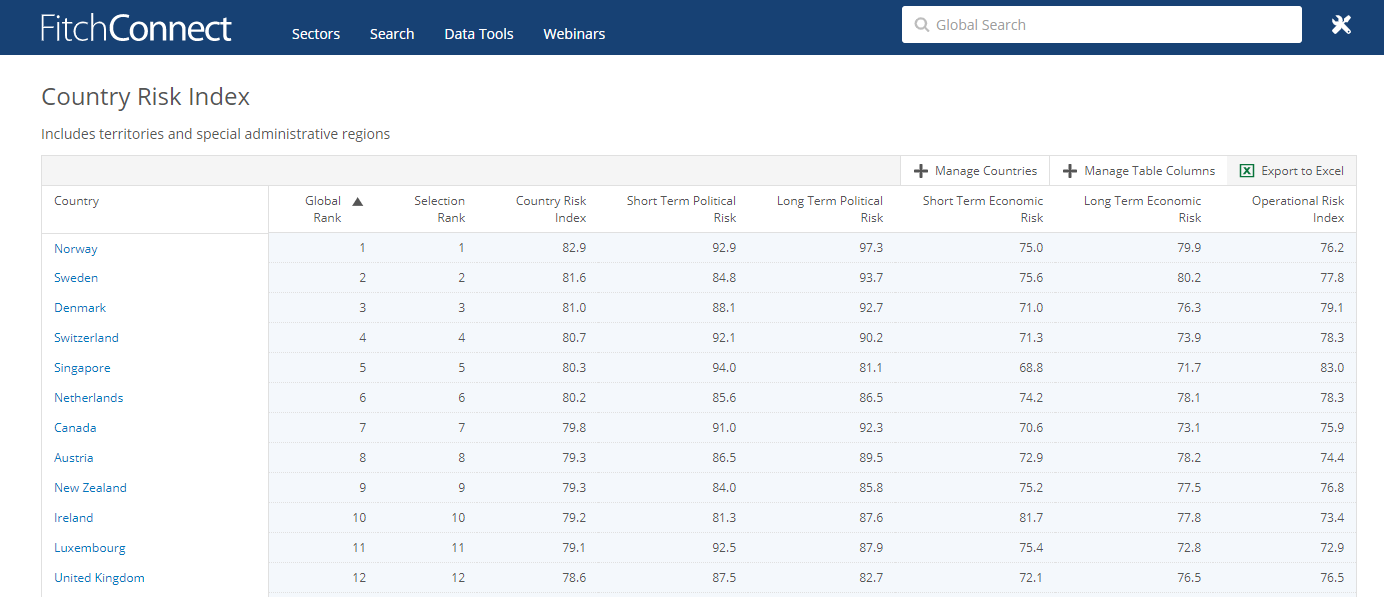 Country risk index If you have any questions on country data or analysis, please do contact MIRC. Feature image from Pixabay. Available at: https://pixabay.com/photos/demonstration-hamburg-g20-human-2477988/ |
| FROM Cranfield SOM Blogs: School of Aerospace, Transport and Manufacturing makes 2,000 journal articles available via open access! |
|
We are delighted to announce that our School of Aerospace, Transport and Manufacturing has reached its 2,000th journal article deposit in CERES, the publicly accessible repository of the University’s research outputs. CERES includes journal articles, PhD theses, book chapters, working papers and technical reports. The article that reached this target was: Hackney R, Nikolaidis T & Pellegrini A. (2020) A method for modelling compressor bleed in gas turbine analysis software. Applied Thermal Engineering, Available online 17 February 2020, Article number 115087 [url=https://dspace.lib.cranfield.ac.uk/handle/1826/15216]Discover the SATM2000th article[/url] [b]How it became number 2,000[/b] As soon as Rick, Theoklis and Alvisehad their paper accepted by the journal on 13 February 2020, they sent the accepted date and their author accepted manuscript (AAM) to the Library’s [b]accepted@[/b] mailbox. Library staff then swiftly processed it. As it was a Green article it has been made discoverable by depositing the citation and abstract into CERES straightaway. The accepted version of the paper will be made publicly available after the publisher embargo period has passed on 18 February 2021. Should anyone be interested in seeing the paper before the embargo has passed it can be requested via the CERES request-a-copy service. The AAM will then be supplied with the author’s permission for personal and educational use only. [b]About CERES and Open Access[/b] CERES was launched in January 2004 and was originally called QuePrints. Since then, it has averaged over 52,000 downloads per month, placing it amongst the top ten of all institutional repositories in the UK. Making Cranfield’s research open access (available publicly with no paywall) is essential, not only for the REF, and as a fulfilment of funding requirements, but also as a showcase for Cranfield’s expertise to the outside world. “CERES is a great resource providing free access to the results of research carried out at Cranfield for more than a decade. It will play a key role in our contribution to the REF 2021 exercise, providing open access to our best research.” (Andrew Kirchner, REF Delivery Manager, Research and Innovation Office) [url=https://dspace.lib.cranfield.ac.uk/]Visit CERES [/url] [b]Could your paper help us achieve the next milestone?[/b] Please help us to continue building CERES by ensuring you deposit your research effectively. All you need to do is: [list][*]Forward your acceptance email from the publisher to [email=accepted@cranfield.ac.uk]accepted@cranfield.ac.uk[/email] [b]as soon as you receive it[/b][/*][*]Attach a copy of your Author Accepted Manuscript[/*][*]Our Open Access Team will then process it in CRIS for inclusion in CERES as soon as any embargoes allow.[/*][/list] *What exactly IS an Author Accepted Manuscript? The author accepted manuscript (AAM) is the final draft manuscript, as accepted for publication by a journal, including modifications based on referees’ suggestions, before it has undergone copyediting, typesetting and proof correction from the publisher. Please ensure it is a ‘clean’ copy – no highlighted or crossed-out text – as the article will be public and therefore needs to look as professional as possible. Questions? If you have any questions about the open access process please contact us via [email=openaccess@cranfield.ac.uk]openaccess@cranfield.ac.uk[/email] Image by [url=https://pixabay.com/users/nidan-455298/?utm_source=link-attribution&utm_medium=referral&utm_campaign=image&utm_content=879461]Heiko Stein[/url] from [url=https://pixabay.com/?utm_source=link-attribution&utm_medium=referral&utm_campaign=image&utm_content=879461]Pixabay[/url] |

|
|
||
|
Hi Generic [Bot],
Here are updates for you:
ANNOUNCEMENTS
 Wednesday, Apr 24, 2024 11:30am NY / 3:30pm London / 9pm Mumbai Watch earlier episodes of DI series below EP1: 6 Hardest Two-Part Analysis Questions EP2: 5 Hardest Graphical Interpretation Questions
Tuck at Dartmouth
AGSM at UNIVERSITY OF CALIFORNIA RIVERSIDE
 GMAT Club REWARDS
|
 close
close

