Events & Promotions
|
|

GMAT Club Daily Prep
Thank you for using the timer - this advanced tool can estimate your performance and suggest more practice questions. We have subscribed you to Daily Prep Questions via email.
Customized
for You
Track
Your Progress
Practice
Pays
Not interested in getting valuable practice questions and articles delivered to your email? No problem, unsubscribe here.
 Nov 19
12:30 PM EST
-01:30 PM EST
Learn how Keshav, a Chartered Accountant, scored an impressive 705 on GMAT in just 30 days with GMATWhiz's expert guidance. In this video, he shares preparation tips and strategies that worked for him, including the mock, time management, and more Nov 18
11:00 AM PST
-12:00 PM PST
Join us in a live GMAT practice session and solve 30 challenging GMAT questions with other test takers in timed conditions, covering GMAT Quant, Data Sufficiency, Data Insights, Reading Comprehension, and Critical Reasoning questions. Nov 20
01:30 PM EST
-02:30 PM IST
Learn how Kamakshi achieved a GMAT 675 with an impressive 96th %ile in Data Insights. Discover the unique methods and exam strategies that helped her excel in DI along with other sections for a balanced and high score. Nov 22
11:00 AM IST
-01:00 PM IST
Do RC/MSR passages scare you? e-GMAT is conducting a masterclass to help you learn – Learn effective reading strategies Tackle difficult RC & MSR with confidence Excel in timed test environment- Nov 23
11:00 AM IST
-01:00 PM IST
Attend this free GMAT Algebra Webinar and learn how to master the most challenging Inequalities and Absolute Value problems with ease.  Nov 24
07:00 PM PST
-08:00 PM PST
Full-length FE mock with insightful analytics, weakness diagnosis, and video explanations! Nov 25
10:00 AM EST
-11:00 AM EST
Prefer video-based learning? The Target Test Prep OnDemand course is a one-of-a-kind video masterclass featuring 400 hours of lecture-style teaching by Scott Woodbury-Stewart, founder of Target Test Prep and one of the most accomplished GMAT instructors.

Kudos
Bookmarks

Dropdown 1: all of the indicated
Dropdown 2: integration capabilities
Be sure to select an answer first to save it in the Error Log before revealing the correct answer (OA)!
Difficulty:
 95%
(hard)
95%
(hard)
Question Stats:
36% (02:28) correct 64%
(02:47)
wrong
based on 1855
sessions
64%
(02:47)
wrong
based on 1855
sessions
History
Date
Time
Result
Not Attempted Yet
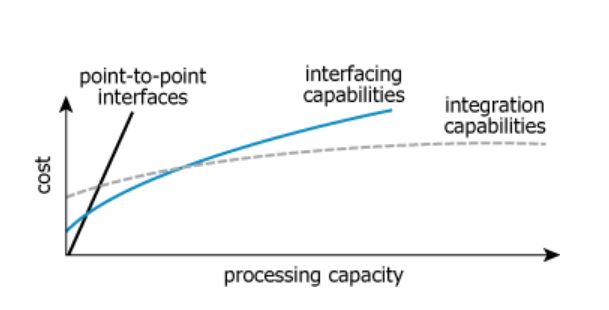
The graph shows an analyst's assessment of how the cost of processing capacity for a certain type of information management software depends on whether that capacity is provided using point-to-point interfaces, interfacing capabilities, or integration capabilities. Most information management software of this type has nonzero capacities provided by all three methods. Cost and capacity levels indicated by the levels of the curves at the far left end of the graph reflect minimums that are shared by all information management software of this type. The lines continue to the right with similar slopes beyond the points shown.
Select from the drop-down menus the options that create the statement that most accurately reflects the information provided.
For the information management software with levels of processing capacity, it would be least expensive to add a small amount of processing capacity by means of .

GMAT-Club-Forum-48c79vnd.png [ 38.36 KiB | Viewed 6534 times ]
The graph shows an analyst's assessment of how the cost of processing capacity for a certain type of information management software depends on whether that capacity is provided using point-to-point interfaces, interfacing capabilities, or integration capabilities. Most information management software of this type has nonzero capacities provided by all three methods. Cost and capacity levels indicated by the levels of the curves at the far left end of the graph reflect minimums that are shared by all information management software of this type. The lines continue to the right with similar slopes beyond the points shown.
Select from the drop-down menus the options that create the statement that most accurately reflects the information provided.
For the information management software with levels of processing capacity, it would be least expensive to add a small amount of processing capacity by means of .
ID: 700211
Attachment:
GMAT-Club-Forum-48c79vnd.png [ 38.36 KiB | Viewed 6534 times ]
ShowHide Answer
Official Answer
Dropdown 1: all of the indicated
Dropdown 2: integration capabilities

Kudos
Bookmarks
Quote:
What does the graph show?
There is an IMS (information management software). The graph shows how the cost of processing capacity for it depends on whether that capacity is provided using point-to-point interfaces, interfacing capabilities, or integration capabilities.
The IMS needs to have some processing capacity. If we want higher capacity, then the cost for it will be more. How much more depends on what is used - point-to-point interfaces, interfacing capabilities, or integration capabilities
The point-to-point (P2P) interface line is a thick black straight line with a constant slope. Every time you increase capacity by 1 unit, cost will increase by a fixed amount (say by 3 units). The slope of the line is high. The cost will be least for P2P only in case of very small amount of processing capacity. Thereafter, the P2P rises above both other graphs.
The interfacing capabilities graph is the blue curve. As processing capacity increases, cost increases but not as sharply as in P2P. The slope of the graph is higher to begin with but it becomes a lot more flatter at high processing capacity.
The integration capabilities graph is the dotted line which is very flat from the beginning itself. It starts at a higher cost (above the other two graphs) but as processing capacity increases, the cost increases minimally.
For the information management software with _________ levels of processing capacity, it would be least expensive to add a small amount of processing capacity by means of __________
We are discussing "adding processing capacity". So if we were to add processing capacity, the cost incurred will be only the additional cost of increasing the capacity. Whatever cost was incurred at the beginning is not to be considered.
The additional cost will be given by the slope of the graph.
Say processing capacity has to be increased from the first red line to the second red line. The rise in the graph (additional cost) is minimum for integration capabilities.
Say processing capacity has to be increased from the first green line to the second green line. The rise in the graph (additional cost) is minimum for integration capabilities.
This will be true for all regions of the graph.
Attachment:
Screenshot 2024-05-30 at 1.16.58 PM.png [ 76.4 KiB | Viewed 14135 times ]
Hence, at all indicated levels of processing capacity, it would be least expensive to add capacity when using integration capabilities.
ANSWER:
all indicated levels
integration capabilities
Attachment:
GMAT-Club-Forum-uzx4d52d.png [ 38.36 KiB | Viewed 6464 times ]


Kudos
Bookmarks
ashutosh_73
'it would be least expensive to add a small amount of processing capacity by means of __2__' means we are looking for the relation between cost and processing capacity, and this would be given by the slope of lines and curves at any point.
Least expensive would mean lesser cost when we increase the processing capacity, that is lesser of flattish slope as move towards right in the graph.
Dwadesh72, the answer to your question lies in the above colored portion. A straight line will always give you the same ratio, which is cost per unit of processing capacity here.The point-to-point interface is a straight line, so irrespective of the location on the line, the cost/processing unit will be the same.
So, if we were asking for most expensive, the point-to-point interface would be correct but the first blank will then be all of the indicated.
Coming to the question,
Now, we know that we have to look for the slope of the curve or line.
The dotted line has the least slope, so least expensive, and this makes it the correct option for the second blank.
Now, the first option would require dividing the horizontal axis in two portions, left and right. Left gives lower levels of processing capacity(pc) and right gives us higher levels of pc.
The slope of dotted line is not constant. It rather tends to move downwards in the higher levels, giving a negative cost. So, mathematically it would be 'Higher but not lower levels' for blank 1, if we look for a specific point.
But, as we are comparing the three lines to each other ( the reason for using least expensive), the dotted line has the least slope through out and hence, 'all of the indicated' would fit in in the first blank.
Attachment:
GMAT-Club-Forum-odykli4m.png [ 38.36 KiB | Viewed 6026 times ]