Events & Promotions
|
|

GMAT Club Daily Prep
Thank you for using the timer - this advanced tool can estimate your performance and suggest more practice questions. We have subscribed you to Daily Prep Questions via email.
Customized
for You
Track
Your Progress
Practice
Pays
Not interested in getting valuable practice questions and articles delivered to your email? No problem, unsubscribe here.
 Nov 19
12:30 PM EST
-01:30 PM EST
Learn how Keshav, a Chartered Accountant, scored an impressive 705 on GMAT in just 30 days with GMATWhiz's expert guidance. In this video, he shares preparation tips and strategies that worked for him, including the mock, time management, and more Nov 18
11:00 AM PST
-12:00 PM PST
Join us in a live GMAT practice session and solve 30 challenging GMAT questions with other test takers in timed conditions, covering GMAT Quant, Data Sufficiency, Data Insights, Reading Comprehension, and Critical Reasoning questions. Nov 20
01:30 PM EST
-02:30 PM IST
Learn how Kamakshi achieved a GMAT 675 with an impressive 96th %ile in Data Insights. Discover the unique methods and exam strategies that helped her excel in DI along with other sections for a balanced and high score. Nov 22
11:00 AM IST
-01:00 PM IST
Do RC/MSR passages scare you? e-GMAT is conducting a masterclass to help you learn – Learn effective reading strategies Tackle difficult RC & MSR with confidence Excel in timed test environment- Nov 23
11:00 AM IST
-01:00 PM IST
Attend this free GMAT Algebra Webinar and learn how to master the most challenging Inequalities and Absolute Value problems with ease.  Nov 24
07:00 PM PST
-08:00 PM PST
Full-length FE mock with insightful analytics, weakness diagnosis, and video explanations! Nov 25
10:00 AM EST
-11:00 AM EST
Prefer video-based learning? The Target Test Prep OnDemand course is a one-of-a-kind video masterclass featuring 400 hours of lecture-style teaching by Scott Woodbury-Stewart, founder of Target Test Prep and one of the most accomplished GMAT instructors.

Kudos
Bookmarks

Dropdown 1: X
Dropdown 2: Z
Be sure to select an answer first to save it in the Error Log before revealing the correct answer (OA)!
Difficulty:
 85%
(hard)
85%
(hard)
Question Stats:
65% (02:49) correct 35%
(03:08)
wrong
based on 822
sessions
35%
(03:08)
wrong
based on 822
sessions
History
Date
Time
Result
Not Attempted Yet

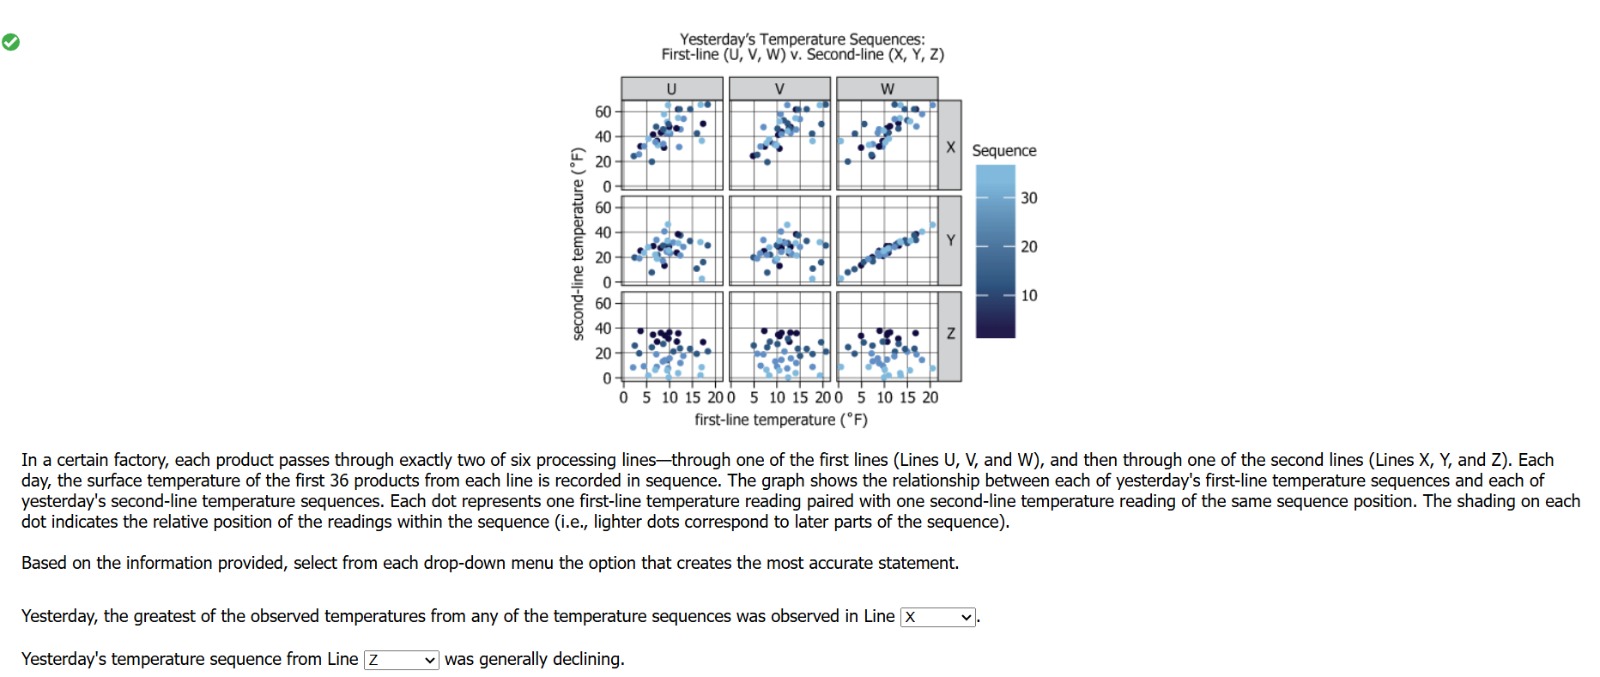
In a certain factory, each product passes through exactly two of six processing lines—through one of the first lines (Lines U, V, and W), and then through one of the second lines (Lines X, Y, and Z). Each day, the surface temperature of the first 36 products from each line is recorded in sequence. The graph shows the relationship between each of yesterday's first-line temperature sequences and each of yesterday's second-line temperature sequences. Each dot represents one first-line temperature reading paired with one second-line temperature reading of the same sequence position. The shading on each dot indicates the relative position of the readings within the sequence (i.e., lighter dots correspond to later parts of the sequence).
Based on the information provided, select from each drop-down menu the option that creates the most accurate statement.
Yesterday, the greatest of the observed temperatures from any of the temperature sequences was observed in Line .
Yesterday's temperature sequence from Line was generally declining.
ShowHide Answer
Official Answer
Dropdown 1: X
Dropdown 2: Z


Kudos
Bookmarks
In a certain factory, each product passes through exactly two of six processing lines—through one of the first lines (Lines U, V, and W), and then through one of the second lines (Lines X, Y, and Z). Each day, the surface temperature of the first 36 products from each line is recorded in sequence. The graph shows the relationship between each of yesterday's first-line temperature sequences and each of yesterday's second-line temperature sequences. Each dot represents one first-line temperature reading paired with one second-line temperature reading of the same sequence position. The shading on each dot indicates the relative position of the readings within the sequence (i.e., lighter dots correspond to later parts of the sequence).
We see that the first lines are depicted by the columns of the graph, with their temperature readings increasing from left to right in each little graph.
The second lines are depicted by the rows of the graph, with their temperature readings increasing from bottom to top in each little graph.
Based on the information provided, select from each drop-down menu the option that creates the most accurate statement.
Yesterday, the greatest of the observed temperatures from any of the temperature sequences was observed in Line _____.
The temperature readings for the first lines go up to a maximum of a little over 20.
The temperature readings for the second lines go up to a maximum of a little over 60.
Looking for the highest temperature in any line, we see that, in all three graphs for the X line, the maximum temperatures are above 60, and those are the highest temperatures found anywhere on the graph.
Select X.
Yesterday's temperature sequence from Line _____ was generally declining.
This question is tricky because we might expect declining temperatures to be represented by patterns on the graphs that decline from left to right. However, we have to keep in mind that left to right movement on each little graph represents not passing of time but rather increases in temperature.
As the passage says, passage of time is represented in the the following way on the graph:
The shading on each dot indicates the relative position of the readings within the sequence (i.e., lighter dots correspond to later parts of the sequence).
So, darker dots represent readings taken at earlier times, and lighter dots represent readings taken at later times.
Accordingly, a graph that shows temperatures declining over the period of time of a sequence will have darker dots, indicating earlier times, for higher temperature readings and lighter dots, indicating later times, for lower temperature readings.
Such a pattern indicates that the temperatures declined as the sequence progressed.
Scanning the graphs, we see that only the graphs for line Z have such a pattern, with darker dots toward the top of the graphs for higher temperature readings and lighter dots toward the bottoms of the graphs for lower temperature readings.
Select Z.
Correct answer: X, Z
General Discussion

playthegame

Johnson Moderator
Joined: 19 Jan 2024
Last visit: 28 Mar 2025
Posts: 423
Given Kudos: 146
Location: Canada
Concentration: Operations, Leadership
Schools: Johnson '27
Products:
Kudos
Bookmarks
Great question, loved it on the mock test. I ended up choosing W instead of X but I mixed up the axes. I also kept thinking about why W was so close U and V only to realize after the test I was reading the wrong axes. The way the labels have been setup they can steer you away from how you typically read labels...at least I did, I was close nevertheless.