Last visit was: 25 Apr 2024, 21:57 It is currently 25 Apr 2024, 21:57

Close
GMAT Club Daily Prep
Thank you for using the timer - this advanced tool can estimate your performance and suggest more practice questions. We have subscribed you to Daily Prep Questions via email.

Customized
for You

we will pick new questions that match your level based on your Timer History

Track
Your Progress

every week, we’ll send you an estimated GMAT score based on your performance

Practice
Pays

we will pick new questions that match your level based on your Timer History
Not interested in getting valuable practice questions and articles delivered to your email? No problem, unsubscribe here.
Close
Request Expert Reply
Confirm Cancel
SORT BY:
Date
Tags:
Show Tags
Hide Tags
User avatar
Intern
Intern
Joined: 20 Oct 2013
Posts: 38
Own Kudos [?]: 7 [0]
Given Kudos: 27
Send PM
Math Expert
Joined: 02 Sep 2009
Posts: 92915
Own Kudos [?]: 619055 [0]
Given Kudos: 81595
Send PM
avatar
Manager
Manager
Joined: 17 Jul 2013
Posts: 59
Own Kudos [?]: 40 [0]
Given Kudos: 67
Send PM
Math Expert
Joined: 02 Sep 2009
Posts: 92915
Own Kudos [?]: 619055 [2]
Given Kudos: 81595
Send PM
Re: Graphic approach to problems with inequalities [#permalink]
2
Bookmarks
Expert Reply
GmatDestroyer2013 wrote:
Can we use this technique to solve any of the in equality ques. My accuracy in such questions suffer.
Please mention how I should approach in equalities.....


Graphic approach is not a silver bullet for inequality questions. Yes, it's handy for some of them but certainly not for all of them.

Hope the links below help to attack them more efficiently:
Theory on Inequalities:
Solving Quadratic Inequalities - Graphic Approach: solving-quadratic-inequalities-graphic-approach-170528.html

inequalities-trick-91482.html
data-suff-inequalities-109078.html
range-for-variable-x-in-a-given-inequality-109468.html
everything-is-less-than-zero-108884.html
graphic-approach-to-problems-with-inequalities-68037.html

All DS Inequalities Problems to practice: search.php?search_id=tag&tag_id=184
All PS Inequalities Problems to practice: search.php?search_id=tag&tag_id=189

700+ Inequalities problems: inequality-and-absolute-value-questions-from-my-collection-86939.html
Manager
Manager
Joined: 22 Jul 2014
Posts: 107
Own Kudos [?]: 888 [0]
Given Kudos: 197
Concentration: General Management, Finance
GMAT 1: 670 Q48 V34
WE:Engineering (Energy and Utilities)
Send PM
Re: Graphic approach to problems with inequalities [#permalink]
Can you please tell me how do you know which region to shade? :( :(
I mean , to the left? or right? above or below the x axis?

How do you find out :?:
Tutor
Joined: 16 Oct 2010
Posts: 14823
Own Kudos [?]: 64925 [1]
Given Kudos: 426
Location: Pune, India
Send PM
Re: Graphic approach to problems with inequalities [#permalink]
1
Kudos
Expert Reply
alphonsa wrote:
Can you please tell me how do you know which region to shade? :( :(
I mean , to the left? or right? above or below the x axis?

How do you find out :?:


So you draw the line showing the equation represented by the inequality. How do you decide which side of the line does the inequality represent. Usually, you can do that by plugging in (0, 0) in the equation. The point (0, 0) will lie on one side of the line. Put x = 0 and y = 0 in your inequality. If it holds, it means the inequality holds for point (0, 0) and hence will hold for that entire side of the line. So you shade the side where (0, 0) lies.
If the inequality does not hold when you put (0, 0), it means (0, 0) is not a solution of the inequality and hence the inequality holds for the opposite side so you shade the opposite side.

If the line passes through (0, 0) try any other point which obviously lies on one side of the line.
User avatar
Manager
Manager
Joined: 26 Feb 2015
Posts: 94
Own Kudos [?]: 203 [0]
Given Kudos: 43
Send PM
Re: Graphic approach to problems with inequalities [#permalink]
I don't understand how we can deduce from (2) that its not sufficient. What I see from the graph, is that y-x=2 never pass the red area. How am I supposed to interpret that graph?

All the other graphs makes sense "Oh okay, don't have any line passing the red part = sufficient" - but the last figure doesn't go through red zone either, yet still insufficient?

Am I supposed to realize that the lines can't pass through that white area just above "TRUE" either?
Tutor
Joined: 16 Oct 2010
Posts: 14823
Own Kudos [?]: 64925 [0]
Given Kudos: 426
Location: Pune, India
Send PM
Re: Graphic approach to problems with inequalities [#permalink]
Expert Reply
erikvm wrote:
I don't understand how we can deduce from (2) that its not sufficient. What I see from the graph, is that y-x=2 never pass the red area. How am I supposed to interpret that graph?

All the other graphs makes sense "Oh okay, don't have any line passing the red part = sufficient" - but the last figure doesn't go through red zone either, yet still insufficient?

Am I supposed to realize that the lines can't pass through that white area just above "TRUE" either?


When the thread gets to the 6th page with, presumably, multiple solutions, you need to quote the post to which you are referring or give its link.
User avatar
Manager
Manager
Joined: 26 Feb 2015
Posts: 94
Own Kudos [?]: 203 [0]
Given Kudos: 43
Send PM
Re: Graphic approach to problems with inequalities [#permalink]
VeritasPrepKarishma wrote:
erikvm wrote:
I don't understand how we can deduce from (2) that its not sufficient. What I see from the graph, is that y-x=2 never pass the red area. How am I supposed to interpret that graph?

All the other graphs makes sense "Oh okay, don't have any line passing the red part = sufficient" - but the last figure doesn't go through red zone either, yet still insufficient?

Am I supposed to realize that the lines can't pass through that white area just above "TRUE" either?


When the thread gets to the 6th page with, presumably, multiple solutions, you need to quote the post to which you are referring or give its link.


Figure 5. Original post. The line y-x=2 never goes through the red zone - yet "insufficient"
Tutor
Joined: 16 Oct 2010
Posts: 14823
Own Kudos [?]: 64925 [1]
Given Kudos: 426
Location: Pune, India
Send PM
Re: Graphic approach to problems with inequalities [#permalink]
1
Kudos
Expert Reply
erikvm wrote:
VeritasPrepKarishma wrote:
erikvm wrote:
I don't understand how we can deduce from (2) that its not sufficient. What I see from the graph, is that y-x=2 never pass the red area. How am I supposed to interpret that graph?

All the other graphs makes sense "Oh okay, don't have any line passing the red part = sufficient" - but the last figure doesn't go through red zone either, yet still insufficient?

Am I supposed to realize that the lines can't pass through that white area just above "TRUE" either?


When the thread gets to the 6th page with, presumably, multiple solutions, you need to quote the post to which you are referring or give its link.


Figure 5. Original post. The line y-x=2 never goes through the red zone - yet "insufficient"


It has nothing to do with whether it passes from the red region or not.

You are given that y - x < 2.
When you draw y - x = 2 in figure 5, you get a line. But what is y - x < 2? It is the area to the right of the line y - x = 2. You can find this by putting in (0, 0) in the inequality y - x < 2. You get 0 - 0 < 2 that is 0 < 2 which is true. Since (0, 0) lies to the right of the line and satisfies the inequality, it means the right of the line is y - x < 2 and the left of the line is y - x > 2.

So you are given that points to the right of y - x = 2 are feasible. Look at all the points to the right of y - x= 2 and that satisfy x/y > 2 (i.e. the green and red regions). Note that of all the points to the right of y - x = 2, some lie in the green region and some lie in the red region (ignoring those that lie in neither region). The ones that lie in green region are those for which 3x+2y < 18. For those that lie in the red region, 3x + 2y > 18. So can we say whether 3x + 2y is less than 18? No. Because some points that satisfy y - x > 2 lie in the reg region and some lie in the green region.

When will an inequality be sufficient. It will be sufficient when the region it points to has points lying only in one region - either red or green.

Mind you, using graphing for inequalities isn't very easy at first. Only once you know instinctively what you are doing will you enjoy it.
Here are three posts that build up on these concepts.
https://www.gmatclub.com/forum/veritas-prep-resource-links-no-longer-available-399979.html#/2010/12 ... he-graphs/
https://www.gmatclub.com/forum/veritas-prep-resource-links-no-longer-available-399979.html#/2010/12 ... s-part-ii/
https://www.gmatclub.com/forum/veritas-prep-resource-links-no-longer-available-399979.html#/2011/01 ... -part-iii/
avatar
Intern
Intern
Joined: 11 Aug 2014
Posts: 7
Own Kudos [?]: 3 [0]
Given Kudos: 82
Location: United States
Concentration: International Business, Entrepreneurship
Schools: HBS '18
GPA: 3.9
Send PM
Re: Graphic approach to problems with inequalities [#permalink]
Bunuel / Chetan2u / Karishma : Your solution to this problem please ?


Thanks
Regards
Tutor
Joined: 16 Oct 2010
Posts: 14823
Own Kudos [?]: 64925 [1]
Given Kudos: 426
Location: Pune, India
Send PM
Re: Graphic approach to problems with inequalities [#permalink]
1
Bookmarks
Expert Reply
parvgugnani wrote:
Bunuel / Chetan2u / Karishma : Your solution to this problem please ?


Thanks
Regards


You can also consider number line.

1. x - y < 2

________________________y __ __ x____________

x cannot be 2 units or more to the right of y. It is either closer or to the left of y (in the green region)
But x/y > 2 so x is more than twice of y.
If y is positive, y must be less than 2. So x will be less than 4 (cannot be 2 or more away from y).
y can take any negative value. x would be to the left of y. When x is to the left of y, it can take any value.
(If say y is 1, x could be 2.5; If y is -1, x could be -2.5)

Is 3x + 2y < 18?
x is less than 4 and y is less than 2 so 3x + 2y is less than 3*4 + 2*2 i.e. 16.
Sufficient.

2. y - x < 2

_________________________x __ __ y ___________

y cannot be 2 units or more to the right of x. It is either closer or to the left of x. (in the green region)
But x/y > 2 so x is more than twice of y.
If y is positive, any value of y is acceptable. y will be to the left of x.

Is 3x + 2y < 18?
We immediately note that since x and y can take large positive values or small ones, 3x + 2y may or may not be less than 18. Not sufficient.

Answer (A)
Intern
Intern
Joined: 28 Nov 2017
Posts: 16
Own Kudos [?]: 6 [0]
Given Kudos: 41
Location: India
Concentration: General Management
GPA: 3.16
WE:Engineering (Energy and Utilities)
Send PM
Re: Graphic approach to problems with inequalities [#permalink]
Bunuel wrote:
If \(\frac{x}{y} > 2\), is \(3x + 2y < 18\)?


\(\frac{x}{y}>2\) tells us that \(x\) and \(y\) are either both positive or both negative, which means that all points \((x,y)\) satisfying given inequality are either in I or III quadrant. When they are both negative (in III quadrant) inequality \(3x+2y<18\) is always true, so we should check only for I quadrant, or when both \(x\) and \(y\) are positive.

In I quadrant, as \(x\) and \(y\) are both positive, we can rewrite \(\frac{x}{y}>2\) as \(x>2y>0\) (remember \(x>0\) and \(y>0\)).

So basically question becomes: If \(x>0\) and \(y>0\) and \(x>2y>0\), is \(3x+2y<18\)?


(1) \(x-y<2\).

Subtract inequalities \(x>2y\) and \(x-y<2\) (we can do this as signs are in opposite direction) --> \(x-(x-y)>2y-2\) --> \(y<2\).

Now add inequalities \(x-y<2\) and \(y<2\) (we can do this as signs are in the same direction) --> \(x-y+y<2+2\) --> \(x<4\).

We got \(y<2\) and \(x<4\). If we take maximum values \(x=4\) and \(y=2\) and substitute in \(3x+2y<18\), we'll get \(12+4=16<18\).

Sufficient.


(2) \(y-x<2\) and \(x>2y\):
\(x=3\) and \(y=1\) --> \(3x+2y=11<18\) true.
\(x=11\) and \(y=5\) --> \(3x+2y=43<18\) false.

Not sufficient.


Answer: A.

THIS QUESTION IS DISCUSSED HERE.


Bunuel I have one doubt. if we see the algebraic approach, the the first condition gives us the solution as y<2 and x<4. However, if i see the graphical approach, these values doesn't satisfy the graphical area satisfied by original condition and condition-1. Clarify where am I going wrong?
Math Expert
Joined: 02 Sep 2009
Posts: 92915
Own Kudos [?]: 619055 [0]
Given Kudos: 81595
Send PM
Re: Graphic approach to problems with inequalities [#permalink]
Expert Reply
gmatacer40 wrote:
Bunuel wrote:
If \(\frac{x}{y} > 2\), is \(3x + 2y < 18\)?


\(\frac{x}{y}>2\) tells us that \(x\) and \(y\) are either both positive or both negative, which means that all points \((x,y)\) satisfying given inequality are either in I or III quadrant. When they are both negative (in III quadrant) inequality \(3x+2y<18\) is always true, so we should check only for I quadrant, or when both \(x\) and \(y\) are positive.

In I quadrant, as \(x\) and \(y\) are both positive, we can rewrite \(\frac{x}{y}>2\) as \(x>2y>0\) (remember \(x>0\) and \(y>0\)).

So basically question becomes: If \(x>0\) and \(y>0\) and \(x>2y>0\), is \(3x+2y<18\)?


(1) \(x-y<2\).

Subtract inequalities \(x>2y\) and \(x-y<2\) (we can do this as signs are in opposite direction) --> \(x-(x-y)>2y-2\) --> \(y<2\).

Now add inequalities \(x-y<2\) and \(y<2\) (we can do this as signs are in the same direction) --> \(x-y+y<2+2\) --> \(x<4\).

We got \(y<2\) and \(x<4\). If we take maximum values \(x=4\) and \(y=2\) and substitute in \(3x+2y<18\), we'll get \(12+4=16<18\).

Sufficient.


(2) \(y-x<2\) and \(x>2y\):
\(x=3\) and \(y=1\) --> \(3x+2y=11<18\) true.
\(x=11\) and \(y=5\) --> \(3x+2y=43<18\) false.

Not sufficient.


Answer: A.

THIS QUESTION IS DISCUSSED HERE.


Bunuel I have one doubt. if we see the algebraic approach, the the first condition gives us the solution as y<2 and x<4. However, if i see the graphical approach, these values doesn't satisfy the graphical area satisfied by original condition and condition-1. Clarify where am I going wrong?


Check the graph below:


Blue region satisfies the following conditions:
\(x>0\) and \(y>0\) and \(x>2y>0\)
\(x-y<2\).

As you can see for that region \(y<2\) and \(x<4\) holds true.


Attachment:
Graph+.png
Graph+.png [ 12.12 KiB | Viewed 2097 times ]
Intern
Intern
Joined: 28 Nov 2017
Posts: 16
Own Kudos [?]: 6 [0]
Given Kudos: 41
Location: India
Concentration: General Management
GPA: 3.16
WE:Engineering (Energy and Utilities)
Send PM
Re: Graphic approach to problems with inequalities [#permalink]
Bunuel wrote:
gmatacer40 wrote:
Bunuel wrote:
If \(\frac{x}{y} > 2\), is \(3x + 2y < 18\)?


\(\frac{x}{y}>2\) tells us that \(x\) and \(y\) are either both positive or both negative, which means that all points \((x,y)\) satisfying given inequality are either in I or III quadrant. When they are both negative (in III quadrant) inequality \(3x+2y<18\) is always true, so we should check only for I quadrant, or when both \(x\) and \(y\) are positive.

In I quadrant, as \(x\) and \(y\) are both positive, we can rewrite \(\frac{x}{y}>2\) as \(x>2y>0\) (remember \(x>0\) and \(y>0\)).

So basically question becomes: If \(x>0\) and \(y>0\) and \(x>2y>0\), is \(3x+2y<18\)?


(1) \(x-y<2\).

Subtract inequalities \(x>2y\) and \(x-y<2\) (we can do this as signs are in opposite direction) --> \(x-(x-y)>2y-2\) --> \(y<2\).

Now add inequalities \(x-y<2\) and \(y<2\) (we can do this as signs are in the same direction) --> \(x-y+y<2+2\) --> \(x<4\).

We got \(y<2\) and \(x<4\). If we take maximum values \(x=4\) and \(y=2\) and substitute in \(3x+2y<18\), we'll get \(12+4=16<18\).

Sufficient.


(2) \(y-x<2\) and \(x>2y\):
\(x=3\) and \(y=1\) --> \(3x+2y=11<18\) true.
\(x=11\) and \(y=5\) --> \(3x+2y=43<18\) false.

Not sufficient.


Answer: A.

THIS QUESTION IS DISCUSSED HERE.


Bunuel I have one doubt. if we see the algebraic approach, the the first condition gives us the solution as y<2 and x<4. However, if i see the graphical approach, these values doesn't satisfy the graphical area satisfied by original condition and condition-1. Clarify where am I going wrong?


Check the graph below:


Blue region satisfies the following conditions:
\(x>0\) and \(y>0\) and \(x>2y>0\)
\(x-y<2\).

As you can see for that region \(y<2\) and \(x<4\) holds true.


Attachment:
Graph+.png


Bunuel
Bunuel, what if we select values x=3.9 and y=0.1.
It satisfies x>0 y>0 x<4 and y<2. However, I observe that this point doesn't come in graphical solution.please explain.

Posted from my mobile device
Math Expert
Joined: 02 Sep 2009
Posts: 92915
Own Kudos [?]: 619055 [0]
Given Kudos: 81595
Send PM
Re: Graphic approach to problems with inequalities [#permalink]
Expert Reply
gmatacer40 wrote:
Bunuel wrote:
gmatacer40 wrote:
If \(\frac{x}{y} > 2\), is \(3x + 2y < 18\)?


\(\frac{x}{y}>2\) tells us that \(x\) and \(y\) are either both positive or both negative, which means that all points \((x,y)\) satisfying given inequality are either in I or III quadrant. When they are both negative (in III quadrant) inequality \(3x+2y<18\) is always true, so we should check only for I quadrant, or when both \(x\) and \(y\) are positive.

In I quadrant, as \(x\) and \(y\) are both positive, we can rewrite \(\frac{x}{y}>2\) as \(x>2y>0\) (remember \(x>0\) and \(y>0\)).

So basically question becomes: If \(x>0\) and \(y>0\) and \(x>2y>0\), is \(3x+2y<18\)?


(1) \(x-y<2\).

Subtract inequalities \(x>2y\) and \(x-y<2\) (we can do this as signs are in opposite direction) --> \(x-(x-y)>2y-2\) --> \(y<2\).

Now add inequalities \(x-y<2\) and \(y<2\) (we can do this as signs are in the same direction) --> \(x-y+y<2+2\) --> \(x<4\).

We got \(y<2\) and \(x<4\). If we take maximum values \(x=4\) and \(y=2\) and substitute in \(3x+2y<18\), we'll get \(12+4=16<18\).

Sufficient.


(2) \(y-x<2\) and \(x>2y\):
\(x=3\) and \(y=1\) --> \(3x+2y=11<18\) true.
\(x=11\) and \(y=5\) --> \(3x+2y=43<18\) false.

Not sufficient.


Answer: A.

THIS QUESTION IS DISCUSSED HERE.


Bunuel I have one doubt. if we see the algebraic approach, the the first condition gives us the solution as y<2 and x<4. However, if i see the graphical approach, these values doesn't satisfy the graphical area satisfied by original condition and condition-1. Clarify where am I going wrong?


Check the graph below:


Blue region satisfies the following conditions:
\(x>0\) and \(y>0\) and \(x>2y>0\)
\(x-y<2\).

As you can see for that region \(y<2\) and \(x<4\) holds true.

Bunuel
Bunuel, what if we select values x=3.9 and y=0.1.
It satisfies x>0 y>0 x<4 and y<2. However, I observe that this point doesn't come in graphical solution.please explain.

Posted from my mobile device


I see what you mean.

x < 4 and y < 2 does NOT mean that ALL points which have have x-coordinate less than 4 and y-coordinate less than 2 will satisfy \(x>0\), \(y>0\), \(x>2y>0\) and\(x-y<2\).

It meas that ALL points which satisfy \(x>0\), \(y>0\), \(x>2y>0\) and\(x-y<2\) will have x-coordinate less than 4 and y-coordinate less than 2.

Or in another way, ALL points in blue region have x-coordinate less than 4 and y-coordinate less than 2 but NOT all points which have x-coordinate less than 4 and y-coordinate less than 2 are in blue region.

Do you see the difference? Does this make sense?
Intern
Intern
Joined: 28 Nov 2017
Posts: 16
Own Kudos [?]: 6 [0]
Given Kudos: 41
Location: India
Concentration: General Management
GPA: 3.16
WE:Engineering (Energy and Utilities)
Send PM
Re: Graphic approach to problems with inequalities [#permalink]
gmatacer40 wrote:
Bunuel wrote:
If \(\frac{x}{y} > 2\), is \(3x + 2y < 18\)?


\(\frac{x}{y}>2\) tells us that \(x\) and \(y\) are either both positive or both negative, which means that all points \((x,y)\) satisfying given inequality are either in I or III quadrant. When they are both negative (in III quadrant) inequality \(3x+2y<18\) is always true, so we should check only for I quadrant, or when both \(x\) and \(y\) are positive.

In I quadrant, as \(x\) and \(y\) are both positive, we can rewrite \(\frac{x}{y}>2\) as \(x>2y>0\) (remember \(x>0\) and \(y>0\)).

So basically question becomes: If \(x>0\) and \(y>0\) and \(x>2y>0\), is \(3x+2y<18\)?


(1) \(x-y<2\).

Subtract inequalities \(x>2y\) and \(x-y<2\) (we can do this as signs are in opposite direction) --> \(x-(x-y)>2y-2\) --> \(y<2\).

Now add inequalities \(x-y<2\) and \(y<2\) (we can do this as signs are in the same direction) --> \(x-y+y<2+2\) --> \(x<4\).

We got \(y<2\) and \(x<4\). If we take maximum values \(x=4\) and \(y=2\) and substitute in \(3x+2y<18\), we'll get \(12+4=16<18\).

Sufficient.


(2) \(y-x<2\) and \(x>2y\):
\(x=3\) and \(y=1\) --> \(3x+2y=11<18\) true.
\(x=11\) and \(y=5\) --> \(3x+2y=43<18\) false.

Not sufficient.


Answer: A.

THIS QUESTION IS DISCUSSED HERE.


Bunuel I have one doubt. if we see the algebraic approach, the the first condition gives us the solution as y<2 and x<4. However, if i see the graphical approach, these values doesn't satisfy the graphical area satisfied by original condition and condition-1. Clarify where am I going wrong?


Bunuel
I see. So, as per our discussion, I conclude that algebraically method of solving has a limitation in the way that it provides superset of solution unlike graphical approach, which gives precisely the solution set only. Am I correct?
However, it seems weird to me since I used to see inequality algebraic method in the other way. For example, if x>5 and y<2 that implies x-y>3; the solution is so precise that every point greater than 3 satisfies the equation. So, still not very clear.
Math Expert
Joined: 02 Sep 2009
Posts: 92915
Own Kudos [?]: 619055 [0]
Given Kudos: 81595
Send PM
Re: Graphic approach to problems with inequalities [#permalink]
Expert Reply
gmatacer40 wrote:
Bunuel
I see. So, as per our discussion, I conclude that algebraically method of solving has a limitation in the way that it provides superset of solution unlike graphical approach, which gives precisely the solution set only. Am I correct?
However, it seems weird to me since I used to see inequality algebraic method in the other way. For example, if x>5 and y<2 that implies x-y>3; the solution is so precise that every point greater than 3 satisfies the equation. So, still not very clear.


Not entirely. The algebraic way, gives you precise ranges too. The point is that for (1) we not only have that x < 4 and y < 2, we also have the other constraints: \(x>0\), \(y>0\), \(x>2y>0\) and\(x-y<2\). If you apply all of them you'll get the same domain as we got from the graphic approach, namely the blue region in my post above.
Intern
Intern
Joined: 29 Jun 2017
Posts: 18
Own Kudos [?]: 16 [0]
Given Kudos: 88
Location: India
GMAT 1: 620 Q48 V27
GPA: 3.48
Send PM
Re: Graphic approach to problems with inequalities [#permalink]
Hi, I have an alternate approach for the same. Please correct if Im wrong.

Given: x/y > 2
=> Inference:
a) x,y are both +ve or both are -ve
b) |x| > |y|

Now,
(1) x - y < 2
if both are positive, then , let x = 7, y = 1
7 - 1 is not LT 2
if both are negative, then, let x = -7, y = -1
-7 - (-1) => -6 < 2 (True)
hence both x and y are negative
therefore in the eq 3x + 2y => always < 0 => sufficient

(2) y - x < 2
if both positive, let x = 7, y = 1, 1 - 7 = -6 < 2 (True)
if both negative, let x = -7, y = -1, -1 - (-7) => 7 not LT 2
Hence both are positive
therefore, if positive values are put in the inequality 3x + 2y => clearly insufficient

Hence, answer is A.
Director
Director
Joined: 22 Feb 2018
Posts: 754
Own Kudos [?]: 1022 [0]
Given Kudos: 134
Send PM
Graphic approach to problems with inequalities [#permalink]
walker wrote:
Hi all! My friend Tarek PMed me and asked to show how to use the graphic approach to problems with inequalities. I really love the approach because it isn't only fast one after training, but also reliable. So, I try to illustrate how to use it.

:fyi There are two distinct ways to solve math problems: logical and visual. The approach described in this post is for those who use the visual approach. If you like imaging math problems in the visual scratchpad in your mind, you will enjoy this method. At the same time, don't be discourage if it doesn't work for you, try the logical approach instead (described by Bunuel).

If \(\frac{x}{y}>2\), is \(3x+2y<18?\)

(1) \(x-y\) is less than \(2\)
(2) \(y-x\) is less than \(2\)

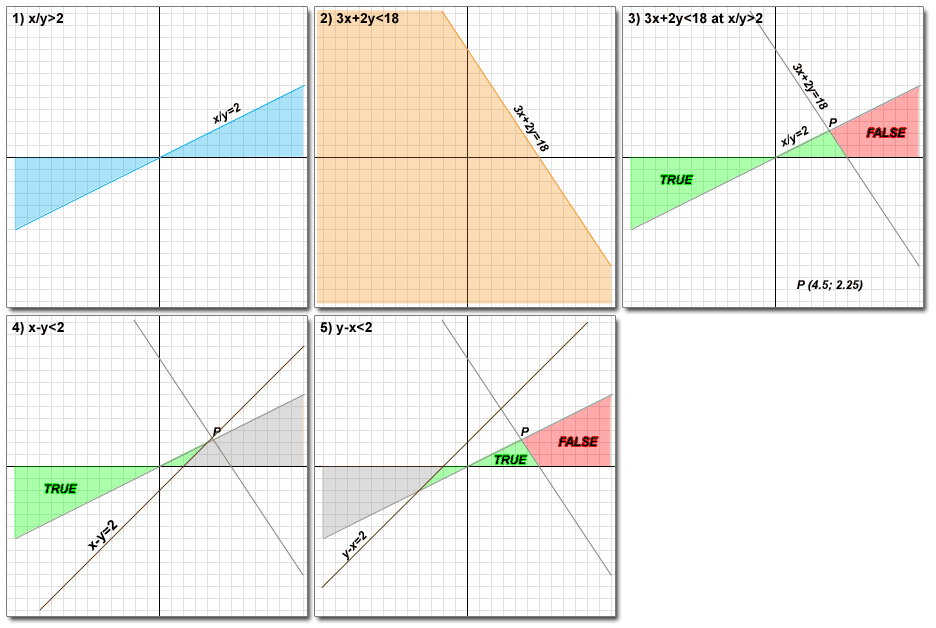
1. First of all, we draw x/y>2. x/y=2 - is a boundary. (see figure 1). we should note that if one of the variables is negative and other is positive, x/y will be always negative and less than 2. Therefore, our set of x,y that satisfied x/y>2 lies between line x/y=2 and x-axis.

2. Next, we draw our main inequality: 3x+2y<18. 3x+2y=18 - is a boundary. (see figure 2).

3. Now, we should combine our main inequality with the restriction, x/y>2. (see figure 3). Eventually, we defined two areas (sets) were the main inequality is TRUE and were it is FALSE. Two lines intersect in point P with coordinates: (4.5;2.25).

4. Let's consider fist condition: x-y<2. x-y=2 is a boundary. (see figure 4). As we can see all y,x that satisfies the fist condition lie in "green-TRUE" region. Therefore, the first statement is sufficient to answer the question. We should be careful and check where line x-y=2 passes point P, through left side or right side. We can put y=2.25 into x-y=2 and find that x=4.25<4.5 (left side). In other words, line x-y=2 passes y=2.25 (y-coordinate of P) early and goes above P.

5. Finally, let's check last condition: y-x<2. y-x=2 is a boundary. (see figure 5). As we can see all y,x that satisfies the second condition lie in both "green-TRUE" and "red-FALSE" regions. Thus, the second condition is insufficient.

So, answer is A.

This approach took less than 2 minutes.


Tips:

1) How fast can we draw a line, for example 3x+2y=18? Simple approach: we need two points to draw line, let's choose intersections with x- and y- axes. x=0 (intersection with y-axis) --> y=9; y=0 (intersection with x-axis) --> x=6.

2) Let's suppose we have a linear inequality, such as 38y-11x>121, suppose we've already drawn the line. How can we find what side is "true" and what side is "false"? The fastest method is just use y=0,x=-infinity. In our case, 0-(-infinity)=infinity>121 - true. Therefore, we take a left side.

See also: THIS QUESTION

That's all :)
Regards,
Walker

Attachment:
tarek99.png


Hi, Bunuel / VeritasKarishma,

I did not get how walker has defined the true and false zone? Please shed some lights as i want to learn the graphic approach.

Thanks.
GMAT Club Bot
Graphic approach to problems with inequalities [#permalink]
   1   2   3   4   
Moderator:
Math Expert
92915 posts

Powered by phpBB © phpBB Group | Emoji artwork provided by EmojiOne