Thank you for using the timer - this advanced tool can estimate your performance and suggest more practice questions. We have subscribed you to Daily Prep Questions via email.
Customized for You
we will pick new questions that match your level based on your Timer History
Track Your Progress
every week, we’ll send you an estimated GMAT score based on your performance
Practice Pays
we will pick new questions that match your level based on your Timer History
Not interested in getting valuable practice questions and articles delivered to your email? No problem, unsubscribe here.
Thank you for using the timer!
We noticed you are actually not timing your practice. Click the START button first next time you use the timer.
There are many benefits to timing your practice, including:
Learn how Keshav, a Chartered Accountant, scored an impressive 705 on GMAT in just 30 days with GMATWhiz's expert guidance. In this video, he shares preparation tips and strategies that worked for him, including the mock, time management, and more.
We know Strengthen and Weaken questions account for more than 50% of the CR questions on the GMAT. With CR becoming even more important on GMAT Focus, it's time you strengthen your weaknesses with an approach that improves your solving time and accuracy!
The Target Test Prep team has recently introduced TTP OnDemand GMAT, a 400-hour live masterclass video course created by Scott Woodbury-Stewart, founder and CEO of Target Test Prep.
Originally posted by Erjan_S on 15 Nov 2017, 02:49.
Last edited by Bunuel on 10 Jun 2024, 03:23, edited 6 times in total.
Updated - Complete topic (35).
Kudos
Add Kudos
30
Bookmarks
Bookmark this Post
Show timer
00:00
Start Timer
Pause Timer
Resume Timer
Show Answer
Hide Answer
Correct Answer
Hide
Show
History
Dropdown 1: strongly positive
Dropdown 2: 0.40
Be sure to select an answer first to save it in the Error Log before revealing the correct answer (OA)!
Select the dropdowns below and click "Submit" to add this question to your Error log.
Difficulty:
35%
(medium)
Question Stats:
54%
(01:26)
correct 46%
(01:44)
wrong
based on 1482
sessions
History
Date
Time
Result
Not Attempted Yet
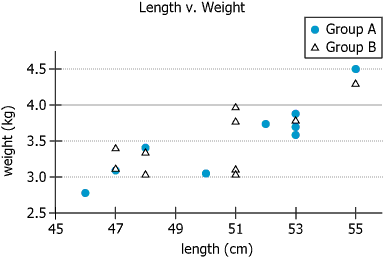
During a four-day period, a height measurement and a weight measurement were recorded shortly after delivery for each baby born in a particular hospital. The 19 babies in the study were divided into two groups, Group A and Group B. The chart shows the length, in centimeters (cm), and weight, in kilograms (kg), for each of the 19 babies.
Based on the given information, use the drop-down menus to most accurately complete the following statements.
The correlation between length and weight for the babies in the study is
If a baby with weight less than 3.5 kg were selected at random, the probability that the baby would be a part of Group A is
It is probably due to structure of GMAT that IR does not count towards total score that there is little interest in IR questions... probably a growing trend for EA acceptance by leading business will change that
During a four-day period, a height measurement and a weight measurement were recorded shortly after delivery for each baby born in a particular hospital. The 19 babies in the study were divided into two groups, Group A and Group B. The chart shows the length, in centimeters (cm), and weight, in kilograms (kg), for each of the 19 babies.
Based on the given information, use the drop-down menus to most accurately complete the following statements.
The correlation between length and weight for the babies in the study is negligible strongly positive . strongly negative
Is there a rule to decide on correlation? What I see here is that two babies with height 47 weigh differently and again at weight 48 and 4 babies with different weights at height 51 where two are much heavier, does not it contradict strong correlation?
To find the correlation, observe the overall trend rather than individual values. You have to oberve the overall direction of the given values. In the given example its clear that height and weight are strongly positively correlated. Check the following link: https://www.statisticshowto.com/directio ... sociation/
Hope it helps.
Reviving this old thread....my issue with this question is that it's not really that strong. There's a few outliers that any academic would then question the entire dataset and need more data to make a real 'strong' conclusion (the question choices are 'Strong correlation' or none).
So, is the goal of any GMAT IR question to spot correlation to just think like someone who is just barely looking at data, or as a data scientist would? Just trying to figure these kinds of questions out,
The correlation is strongly positive. Potentially such type of problems would be easier to solve for those who are familiar with statistics, specifically regression models. If you try to formulate a linear equation basing on the figures above you would find that the trend is upward sloping showing general strong positive correlation.
1. The correlation between length and weight for the babies in the study is:
Among all of the babies in the study, the graph shows that greater lengths tend to correspond to greater weights. This indicates a strongly positive correlation between length and weight.
The correct answer is strongly positive.
2. If a baby with weight less than 3.5 kg were selected at random, the probability that the baby would be a part of Group A is_____________.
In the graph there are 4 blue circles and 6 triangles below the horizontal line at 3.5 kg. This indicates that 10 babies in the study weighed less than 3.5 kg, and that of these 10, 4 were in Group A. Thus, the probability that the randomly selected baby was a part of Group A is 4/10=0.40.
During a four-day period, a height measurement and a weight measurement were recorded shortly after delivery for each baby born in a particular hospital. The 19 babies in the study were divided into two groups, Group A and Group B. The chart shows the length, in centimeters (cm), and weight, in kilograms (kg), for each of the 19 babies.
Based on the given information, use the drop-down menus to most accurately complete the following statements.
1. The correlation between length and weight for the babies in the study is:
but there are many babies who weighted less when height was more. how can we say strongly positive?? if we draw a graph connecting each point, it increases and decreases through out the values, hence it shouldn't be - strongly positive. Can anyone please help? Need an expert opinion here. BunuelReedArnoldMPREPRonTargetTestPrep Thanks
During a four-day period, a height measurement and a weight measurement were recorded shortly after delivery for each baby born in a particular hospital. The 19 babies in the study were divided into two groups, Group A and Group B. The chart shows the length, in centimeters (cm), and weight, in kilograms (kg), for each of the 19 babies.
Based on the given information, use the drop-down menus to most accurately complete the following statements.
The correlation between length and weight for the babies in the study is negligible strongly positive . strongly negative
Is there a rule to decide on correlation? What I see here is that two babies with height 47 weigh differently and again at weight 48 and 4 babies with different weights at height 51 where two are much heavier, does not it contradict strong correlation?
To find the correlation, observe the overall trend rather than individual values. You have to oberve the overall direction of the given values. In the given example its clear that height and weight are strongly positively correlated. Check the following link: https://www.statisticshowto.com/directi ... sociation/
Hope it helps.
Reviving this old thread....my issue with this question is that it's not really that strong. There's a few outliers that any academic would then question the entire dataset and need more data to make a real 'strong' conclusion (the question choices are 'Strong correlation' or none).
So, is the goal of any GMAT IR question to spot correlation to just think like someone who is just barely looking at data, or as a data scientist would? Just trying to figure these kinds of questions out,
Totally agree with you here. There are some outliers obviously. If they phrase the answer choice a bit differently, I can live with that.
It is probably due to structure of GMAT that IR does not count towards total score that there is little interest in IR questions... probably a growing trend for EA acceptance by leading business will change that
How can we say that this is "strongly positive" ? KarishmaBGMATinsightchetan2u Can you please explain the first question ?
sayan640 - I would appreciate if you didn't mention the answer (strongly positive) in the query. It makes me go in with a bias and then I keep wondering whether confirmation bias is at play in my thinking here. Though, I admit, in this question it didn't matter since there is only one suitable option.
We see that there is certainly a positive correlation. The trend line is obvious and the data points are close to the trend line. There is only one option with positive correlation and that is "strongly positive". So that is correct. An r of 0.6 to 0.8 is considered "strong" and looking at the data, it does seem to be a case of strong correlation, not "weak" and not "very strong" either. But they don't ask us to make that call because we can't actually calculate r.
Got Admitted to MBA program? Join us on Apr 3 & Apr 10 to discover how to choose the right MBA, finance it, and meet McKinsey and Amazon recruiters!