KarishmaB Abhivas
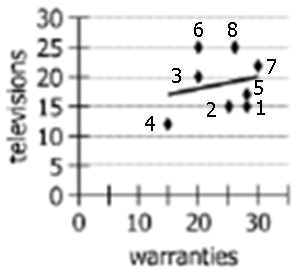
For a certain electronics retailer during each of eight days, both of the graphs show the number of televisions sold and the number of extended warranties sold (whether for televisions or for any other products sold at the store). The scatterplot also includes a trendline that shows the correlation between the daily numbers of televisions and warranties sold.
Select from the drop-down menus the options that complete the statement so that it is accurate based on the information provided.
Among the days represented in the graphs, without the data for Day [Dropdown Placeholder #1] , the daily numbers of televisions and extended warranties sold would [Dropdown Placeholder #2] .
Note that the correlation depicted in the table is not positive correlation. Positive correlation means that if one variable increases, the other increases too and if one decreases, the other decreases too. But what we see is a predominantly negative correlation. When television bar increases/decreases, the warranty bar decreases/increases in most data points. The exception is Day 4 when both decrease together. If I were to remove day 4, the table will depict a negative correlation.
The scatter plot has all the points and the trendline showing positive correlation only because of the first point on the left (circled in Red). This point is the data of Day 4. Remove this point and your trendline changes to the one shown in green. It is negatively correlated. (shown in the attachment)
Hence the ANSWER here will be '
Day 4' and '
No longer positively correlated'.
You can read about Correlation and Trendlines in my Data Insights Module. It will be freely available tomorrow (Sunday) under the Super Sundays program.
Details of Super Sundays available here. Hi @KarishmaB @chetan2u
I understood why
'Day 4' and 'No longer positively correlated' is the answer but i am confused about why
Day 1 and still be positively, though more strongly, correlated will not be the answer.
Below is my understanding: Because of Day-1 data, graph is going downwards, but if we remove this Day-1 data, we are removing one negative slope and graph will have a positive slope for MOST of days. Please help!!


Day 1 doesn't have much impact on the correlation. The number of televisions doesn't change from Day 1 to Day 2 and number of warranties decline very slightly. So this data point doesn't give us much information and removing it won't have much impact. On the other hand, Day 4 is actually opposite of the usual trend and removing it reverses the trend.
above and find Day 1 on it. If you remove it, can we say that the line must have become steeper? We can't really say. The placement of points is very similar to before.


 73%
(02:50)
wrong
73%
(02:50)
wrong 


 close
close