Events & Promotions
|
|

GMAT Club Daily Prep
Thank you for using the timer - this advanced tool can estimate your performance and suggest more practice questions. We have subscribed you to Daily Prep Questions via email.
Customized
for You
Track
Your Progress
Practice
Pays
Not interested in getting valuable practice questions and articles delivered to your email? No problem, unsubscribe here.
 Jun 11
11:00 AM EDT
-01:00 PM EDT
TTP GMAT OnDemand gives serious students 400+ hours of expert video instruction, the full TTP course, AI support, weekly office hours, and a 715+ score guarantee—all built for elite GMAT score improvement. Jun 10
06:00 AM PDT
-06:15 PM PDT
Register for the GMAT Club Virtual MBA Spotlight Fair – the world’s premier event for serious MBA candidates. This is your chance to hear directly from Admissions Directors at nearly every Top 30 MBA program..- Jun 10
10:00 AM PDT
-11:00 AM PDT
Scoring 715 on the GMAT Focus Edition requires more than just learning formulas, memorizing concepts, or solving hundreds of questions. In this episode, Nishant shares how he improved his GMAT preparation by focusing on application of concepts, and more.  Jun 22
07:30 PM EDT
-09:30 PM EDT
Master the GMAT with expert live instruction, a personalized study plan, and real-time support. Includes 40 hours of online classes plus 6 months of access to the TTP GMAT OnDemand video course. Class date: Mon/Wed June 22, 2026 →August 26, 2026


Kudos
Bookmarks
Dropdown 1: Lab D
Dropdown 2: the same as
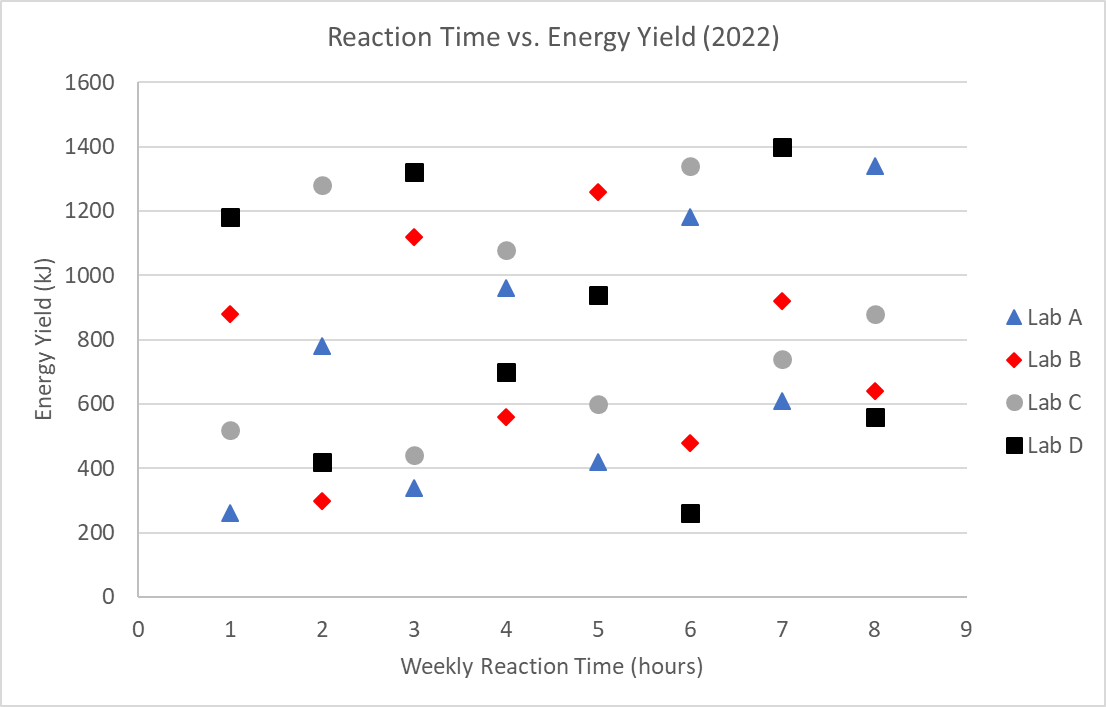
The graph provides data on weekly reaction times and resulting energy yields from 32 trials carried out by four research labs in the Andean Valley in 2022. Each lab conducted eight trials, and for every trial both the reaction time (in hours) and the resulting energy yield (in kilojoules) were recorded.
Select from each drop-down menu the option that creates the most accurate statement based on the information provided.
The range of the recorded energy yields was greatest for Lab .
The median reported reaction time for all trials across the four labs was the median reported reaction time for all trials across the three labs excluding Lab D.
ShowHide Answer
Official Answer
Dropdown 1: Lab D
Dropdown 2: the same as
Kudos
Bookmarks
Official Solution:
Drop-down 1:
The range of a data set is the maximum value minus the minimum value.
From the graph, the lowest yield is 260 and the highest yield is 1400, both from Lab D. Since both extremes belong to Lab D, Lab D has the greatest range.
Correct answer: Lab D
Drop-down 2:
The median is the middle value of a data set in ascending order, or the average of the two middle values if the total number is even.
Across all 32 trials, the median is the average of the 16th and 17th values: (4 + 5)/2 = 4.5.
Across the 24 trials excluding Lab D, the median is the average of the 12th and 13th values: (4 + 5)/2 = 4.5.
Thus, the two medians are the same.
Correct answer: the same as
Correct answer:
Dropdown 1: "Lab D"
Dropdown 2: "the same as"
Bunuel
Drop-down 1:
The range of a data set is the maximum value minus the minimum value.
From the graph, the lowest yield is 260 and the highest yield is 1400, both from Lab D. Since both extremes belong to Lab D, Lab D has the greatest range.
Correct answer: Lab D
Drop-down 2:
The median is the middle value of a data set in ascending order, or the average of the two middle values if the total number is even.
Across all 32 trials, the median is the average of the 16th and 17th values: (4 + 5)/2 = 4.5.
Across the 24 trials excluding Lab D, the median is the average of the 12th and 13th values: (4 + 5)/2 = 4.5.
Thus, the two medians are the same.
Correct answer: the same as
Correct answer:
Dropdown 1: "Lab D"
Dropdown 2: "the same as"


