Events & Promotions
|
|

GMAT Club Daily Prep
Thank you for using the timer - this advanced tool can estimate your performance and suggest more practice questions. We have subscribed you to Daily Prep Questions via email.
Customized
for You
Track
Your Progress
Practice
Pays
Not interested in getting valuable practice questions and articles delivered to your email? No problem, unsubscribe here.
 May 18
10:00 AM PDT
-11:00 AM PDT
Join us in a live GMAT practice session and solve 25 challenging GMAT questions with other test takers in timed conditions, covering GMAT Quant, Data Sufficiency, Data Insights, Reading Comprehension, and Critical Reasoning questions. May 12
12:00 PM EDT
-11:59 PM EDT
Make the most of your break with the most realistic GMAT™ prep. Take up to $700 off select products. Ends 6/1 May 15
01:00 PM IST
-11:00 AM IST
Start your journey with a fully customized action plan and work with a dedicated mentor to achieve a 735+ score.- May 19
12:00 PM PDT
-01:00 PM PDT
Scoring 329 on the GRE is not always about using more books, more courses, or a longer study plan. In this episode of GRE Success Talks, Ashutosh shares his GRE preparation strategy, study plan, and test-day experience, explaining how he kept his prep....  May 20
12:30 AM EDT
-01:30 AM EDT
Struggling to find the right strategies to score a 99 %ile on GMAT Focus? Riya (GMAT 715) boosted her score by 100-points in just 15 days! Discover how the right mentorship, tailored strategies, and an unwavering mindset can transform your GMAT prep. May 21
01:00 AM EDT
-02:00 AM EDT
Looking for your GMAT motivation to break through the score plateau? Pragati improved her score by massive 160 points with strategic guidance and hard-work! Find out how personalized mentorship and a strong mindset can turn GMAT struggles into success. May 23
10:00 AM PDT
-11:00 AM PDT
Video explanations + diagnosis of 10 weakest areas + 150+ short videos + study plan!- Jun 10
06:00 AM PDT
-06:15 PM PDT
Register for the GMAT Club Virtual MBA Spotlight Fair – the world’s premier event for serious MBA candidates. This is your chance to hear directly from Admissions Directors at nearly every Top 30 MBA program..

Kudos
Bookmarks

Dropdown 1: small
Dropdown 2: large
Be sure to select an answer first to save it in the Error Log before revealing the correct answer (OA)!
Difficulty:
 5%
(low)
5%
(low)
Question Stats:
97% (01:20) correct 3%
(01:34)
wrong
based on 1437
sessions
3%
(01:34)
wrong
based on 1437
sessions
History
Date
Time
Result
Not Attempted Yet
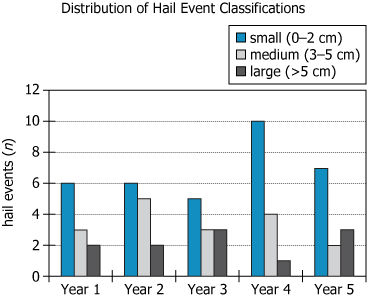
The hail events in a certain region are classified by the diameter of the largest hail stone measured in the event: small (0–2 cm), medium (3–5 cm), and large ( > 5 cm). The graph shows the distribution of classifications of all of the hail events in this region over the span of 5 years.
Select from each drop-down menu the option that creates the most accurate statement based on the information provided.
Of the years reflected in the graph, the year when this region had the greatest total number of hail events was the year when this region had the greatest number of hail events and the least number of hail events.
ID: 700208
ShowHide Answer
Official Answer
Dropdown 1: small
Dropdown 2: large

Kudos
Bookmarks
gmatt1476
Of the years reflected in the graph, the year when this region had the greatest total number of hail events was the year when this region had the greatest number of _____ hail events and the least number of ___ hail events.
First we will quickly check which year had the maximum number of hail events.
Year 4 seems to have the maximum so check that first. It has 10 + 4 + 1 = 15 events.
Year 1 has 6 + 3 + 2 = 11 events
Year 2 has 2 more than 11 and year 3 has a similar number too. Year 5 has fewer too.
So year 4 had maximum number of hail events.
This year saw the greatest number of small events (blue bar) and the least number of large events (black bar)
ANSWER - small, large

Kudos
Bookmarks
1. We are asked to fill in the blanks, however to do so, we must first find the year with the greatest total number of hail events.
2. Let's calculate the total number of hail events for all 5 years:
- Year 1. Small + Medium + Large \(= 6 + 3 + 2 = 11\).
- Year 2. Small + Medium + Large \(= 6 + 5 + 2 = 13\).
- Year 3. Small + Medium + Large \(= 5 + 3 + 3 = 11\).
- Year 4. Small + Medium + Large \(= 10 + 4 + 1 = 15\).
- Year 5. Small + Medium + Large \(= 7 + 2 + 3 = 12\).
Here, year 4 clearly has the largest amount.
3. During year 4 the greatest amount of hail events were small (10) and the least were large (1).
4. Our answer will be: D1 - small and D2 - large.
--------------------------------------
In practice, you can notice how the spike for year 4 (small hail events) is so large and the other two hail events are comparable, so years 1-3 can be ignored. This would mean that only crucial calculations are for years 4 and 5.


