Events & Promotions
|
|

GMAT Club Daily Prep
Thank you for using the timer - this advanced tool can estimate your performance and suggest more practice questions. We have subscribed you to Daily Prep Questions via email.
Customized
for You
Track
Your Progress
Practice
Pays
Not interested in getting valuable practice questions and articles delivered to your email? No problem, unsubscribe here.
 May 21
10:00 AM EDT
-11:59 PM EDT
Make the most of your break with the most realistic GMAT™ prep. Take up to $700 off select products. May 28
08:30 AM PDT
-09:30 AM PDT
Are you constantly rereading GMAT RC passages but still struggling to understand them? Most students think rereading improves accuracy — but in reality, it usually signals a flawed reading strategy. May 30
12:30 AM EDT
-01:30 AM EDT
Struggling to find the right strategies to score a 99 %ile on GMAT Focus? Riya (GMAT 715) boosted her score by 100-points in just 15 days! Discover how the right mentorship, tailored strategies, and an unwavering mindset can transform your GMAT prep. May 31
01:00 AM EDT
-02:00 AM EDT
Looking for your GMAT motivation to break through the score plateau? Pragati improved her score by massive 160 points with strategic guidance and hard-work! Find out how personalized mentorship and a strong mindset can turn GMAT struggles into success. May 31
02:00 PM PDT
-03:00 PM PDT
Video explanations + diagnosis of 10 weakest areas + 150+ short videos + study plan!- Jun 10
06:00 AM PDT
-06:15 PM PDT
Register for the GMAT Club Virtual MBA Spotlight Fair – the world’s premier event for serious MBA candidates. This is your chance to hear directly from Admissions Directors at nearly every Top 30 MBA program..

Kudos
Bookmarks

Dropdown 1: DK
Dropdown 2: NL
Be sure to select an answer first to save it in the Error Log before revealing the correct answer (OA)!
Difficulty:
 65%
(hard)
65%
(hard)
Question Stats:
69% (02:32) correct 31%
(02:26)
wrong
based on 3411
sessions
31%
(02:26)
wrong
based on 3411
sessions
History
Date
Time
Result
Not Attempted Yet
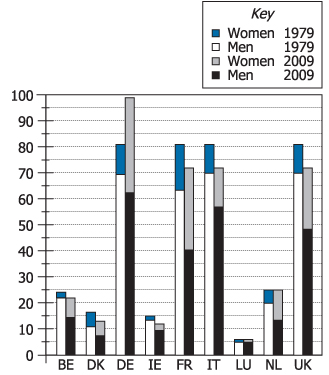
In 1979 when the European Union elected its first Parliament, the Union had 9 member states: Belgium (BE), Denmark (DK), Germany (DE), Ireland (IE), France (FR), Italy (IT), Luxembourg (LU), the Netherlands (NL), and the United Kingdom (UK).
The graph shown has 9 pairs of bars—1 pair for each of those 9 member states. The first bar in each pair represents the composition by gender of the state’s members in the Parliament elected in 1979, and the second bar represents the composition by gender of the state’s members in the Parliament elected in 2009.
In the following statements, the terms least, greatest, and most apply to only the 9 member states represented in the graph. Use the drop-down menus to create the most accurate statements based on the information provided.
If a member were chosen at random from each state’s members in the 1979 Parliament, the state most likely to have had a woman chosen is .
If the member states were arranged in order from least number of members to greatest number of members in the 1979 Parliament, would be in the middle.
ID: 100380
ShowHide Answer
Official Answer
Dropdown 1: DK
Dropdown 2: NL
Solving this question helps.
Taking a timed set of similar questions in
GMAT Club Forum Quiz →
is even better.

Kudos
Bookmarks
DK, NL
For (1), We need to find probability of women in each case. we can see option has choice between DK, NL, FR, UK. FR and UK has same height bar. UK can be eliminated since blue bar is shorter. Hence we are left with DK, NL, FR. DK, NL has approximate same blue bar but total members more in NL, So NL can be eliminated. We are left with DK and FR in which FR probability will come around (1/4) and DK will come around (1/3). Hence DK will be our answer.
For (2) we need to see 5th highest bar which is NL
General Discussion