Events & Promotions
|
|

GMAT Club Daily Prep
Thank you for using the timer - this advanced tool can estimate your performance and suggest more practice questions. We have subscribed you to Daily Prep Questions via email.
Customized
for You
Track
Your Progress
Practice
Pays
Not interested in getting valuable practice questions and articles delivered to your email? No problem, unsubscribe here.
 May 18
10:00 AM PDT
-11:00 AM PDT
Join us in a live GMAT practice session and solve 25 challenging GMAT questions with other test takers in timed conditions, covering GMAT Quant, Data Sufficiency, Data Insights, Reading Comprehension, and Critical Reasoning questions. May 12
12:00 PM EDT
-11:59 PM EDT
Make the most of your break with the most realistic GMAT™ prep. Take up to $700 off select products. Ends 6/1 May 15
01:00 PM IST
-11:00 AM IST
Start your journey with a fully customized action plan and work with a dedicated mentor to achieve a 735+ score. May 17
01:00 AM EDT
-02:00 AM EDT
Looking for your GMAT motivation to break through the score plateau? Pragati improved her score by massive 160 points with strategic guidance and hard-work! Find out how personalized mentorship and a strong mindset can turn GMAT struggles into success.- May 19
12:00 PM PDT
-01:00 PM PDT
Scoring 329 on the GRE is not always about using more books, more courses, or a longer study plan. In this episode of GRE Success Talks, Ashutosh shares his GRE preparation strategy, study plan, and test-day experience, explaining how he kept his prep....  May 20
12:30 AM EDT
-01:30 AM EDT
Struggling to find the right strategies to score a 99 %ile on GMAT Focus? Riya (GMAT 715) boosted her score by 100-points in just 15 days! Discover how the right mentorship, tailored strategies, and an unwavering mindset can transform your GMAT prep. May 23
10:00 AM PDT
-11:00 AM PDT
Video explanations + diagnosis of 10 weakest areas + 150+ short videos + study plan!- Jun 10
06:00 AM PDT
-06:15 PM PDT
Register for the GMAT Club Virtual MBA Spotlight Fair – the world’s premier event for serious MBA candidates. This is your chance to hear directly from Admissions Directors at nearly every Top 30 MBA program..


Kudos
Bookmarks

Dropdown 1: 8
Dropdown 2: 5
Be sure to select an answer first to save it in the Error Log before revealing the correct answer (OA)!
Difficulty:
 5%
(low)
5%
(low)
Question Stats:
82% (01:17) correct 18%
(01:39)
wrong
based on 599
sessions
18%
(01:39)
wrong
based on 599
sessions
History
Date
Time
Result
Not Attempted Yet
For a certain community, the graph shows the total number of new homes built in each of the last 15 years. The annual change in the number of new homes built for a given year is the total number of homes built that year minus the total number of homes built in the previous year.
Select from the drop-down menus the options that create the statement that most accurately reflects the information provided.
Among the Years 2-15, the first year for which the annual change in the number of new homes built was negative was Year , and that year was immediately followed by exactly consecutive years for which the annual change in the number of new homes built was positive.
You're trying to find out the annual change that is less than the year prior. The first instance where this is shown is in year 8 where the number of new homes built is closer to 800 while in year 7, it's closer to 900. This then follows a period where year 9-13 have increases and then another decrease in year 14.
Attachment:
GMAT-Club-Forum-48hnu7mk.png [ 9.53 KiB | Viewed 2614 times ]
Attachment:
GMAT-Club-Forum-kxyqeyba.png [ 72.42 KiB | Viewed 2083 times ]
ShowHide Answer
Official Answer
Dropdown 1: 8
Dropdown 2: 5
Need more Tests to Practice?
GMAT Club Tests give expert solutions for every question in full and sectional GMAT Focus mocks.
Learn more →


Kudos
Bookmarks
ccarson
Is the source of the question Official Guide or GMAT Prep Focus? Can you please provide a screenshot? Thank you!
Attachment:
GMAT-Club-Forum-7hditi36.png [ 9.53 KiB | Viewed 2583 times ]
Kudos
Bookmarks
I found it on the GMAT practice exam 5. 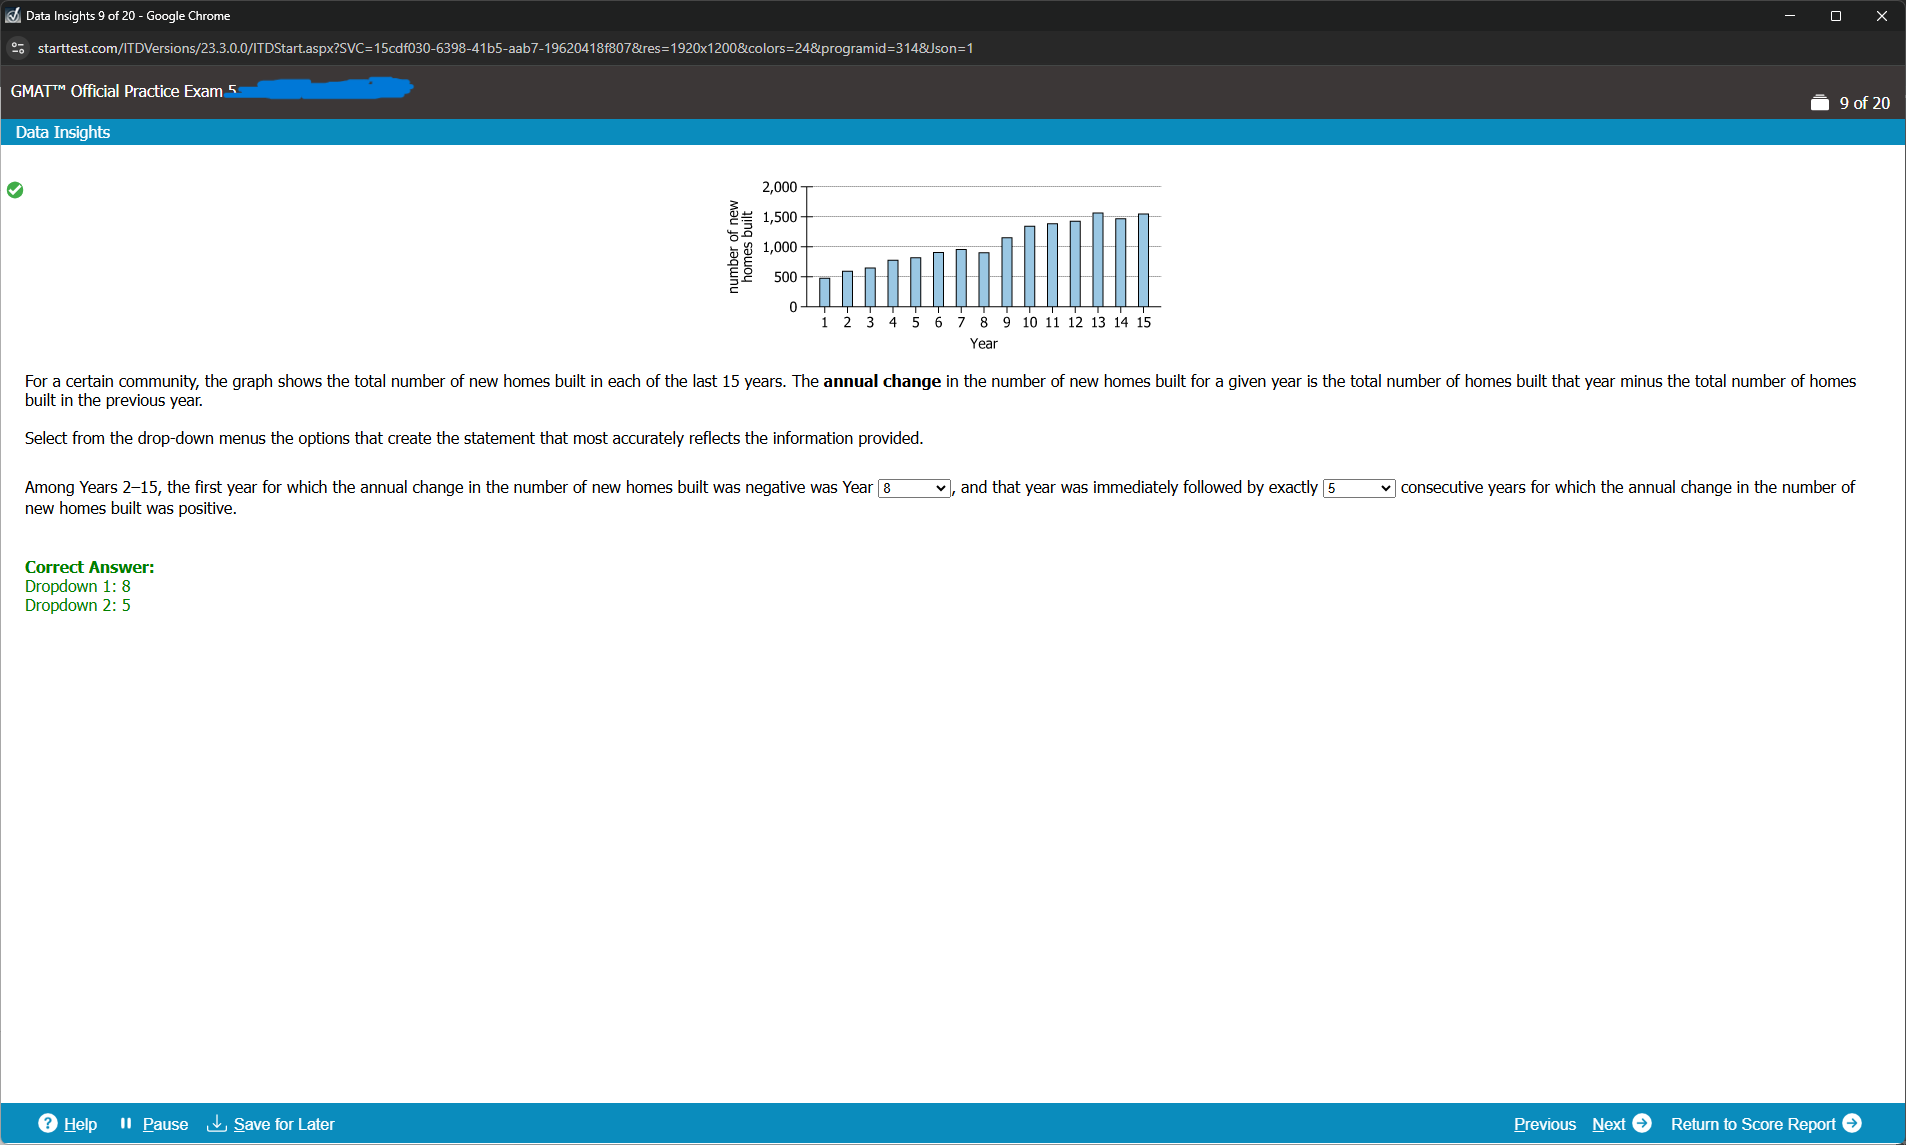

GMAT-Club-Forum-08eozbgp.png [ 72.42 KiB | Viewed 2515 times ]

GMAT-Club-Forum-7xhseh9c.png [ 9.53 KiB | Viewed 2415 times ]
Bunuel
Attachment:
GMAT-Club-Forum-08eozbgp.png [ 72.42 KiB | Viewed 2515 times ]
Attachment:
GMAT-Club-Forum-7xhseh9c.png [ 9.53 KiB | Viewed 2415 times ]