Events & Promotions
|
|

GMAT Club Daily Prep
Thank you for using the timer - this advanced tool can estimate your performance and suggest more practice questions. We have subscribed you to Daily Prep Questions via email.
Customized
for You
Track
Your Progress
Practice
Pays
Not interested in getting valuable practice questions and articles delivered to your email? No problem, unsubscribe here.
 May 08
08:00 PM PDT
-09:00 PM PDT
Free- full-length test + 15 concept videos + 150+ short videos + study plan! May 09
12:30 AM EDT
-01:30 AM EDT
Struggling to find the right strategies to score a 99 %ile on GMAT Focus? Riya (GMAT 715) boosted her score by 100-points in just 15 days! Discover how the right mentorship, tailored strategies, and an unwavering mindset can transform your GMAT prep. May 08
08:00 AM PDT
-08:30 AM PDT
Join the special YouTube live-stream for selecting the winners of GMAT Club MBA Scholarships sponsored by Juno live. Watch who gets these coveted MBA scholarships offered by GMAT Club and Juno. May 10
01:00 AM EDT
-02:00 AM EDT
Stuck at the same GMAT score? Plateaus aren’t about effort—they’re about approach. Watch Srikar’s journey to uncover what truly drives score improvement—and how you can apply it to break your plateau.- May 15
06:00 PM PDT
-07:00 PM PDT
Start your free trial!


N
Be sure to select an answer first to save it in the Error Log before revealing the correct answer (OA)!
Difficulty:
(N/A)
Question Stats:
25% (04:53) correct 75%
(00:23)
wrong
based on 22
sessions
75%
(00:23)
wrong
based on 22
sessions
History
Date
Time
Result
Not Attempted Yet
Hi all! My friend Tarek PMed me and asked to show how to use the graphic approach to problems with inequalities. I really love the approach because it isn't only fast one after training, but also reliable. So, I try to illustrate how to use it.
:fyi There are two distinct ways to solve math problems: logical and visual. The approach described in this post is for those who use the visual approach. If you like imaging math problems in the visual scratchpad in your mind, you will enjoy this method. At the same time, don't be discourage if it doesn't work for you, try the logical approach instead (described by Bunuel).
If \(\frac{x}{y}>2\), is \(3x+2y<18?\)
(1) \(x-y\) is less than \(2\)
(2) \(y-x\) is less than \(2\)
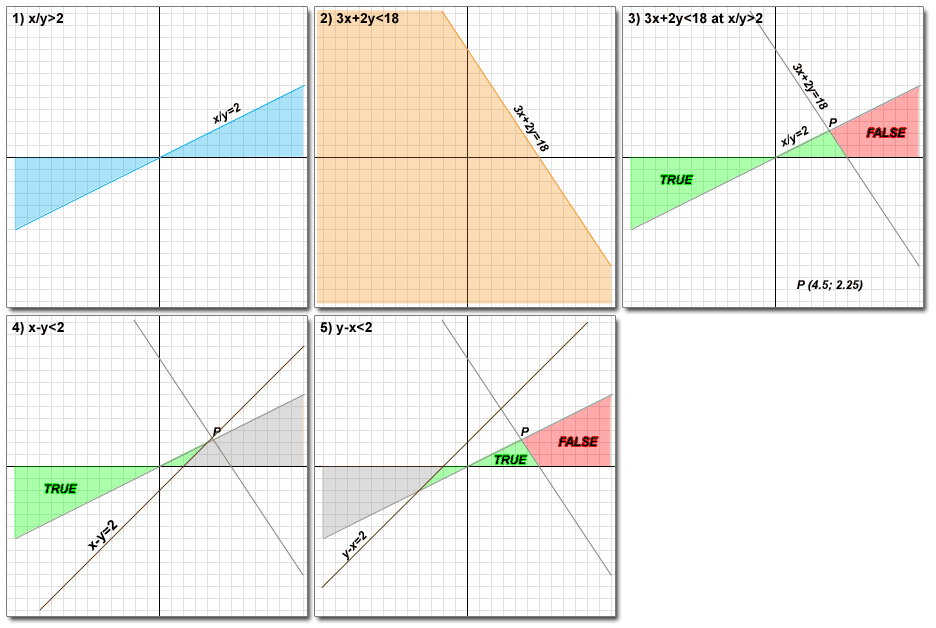
1. First of all, we draw x/y>2. x/y=2 - is a boundary. (see figure 1). we should note that if one of the variables is negative and other is positive, x/y will be always negative and less than 2. Therefore, our set of x,y that satisfied x/y>2 lies between line x/y=2 and x-axis.
2. Next, we draw our main inequality: 3x+2y<18. 3x+2y=18 - is a boundary. (see figure 2).
3. Now, we should combine our main inequality with the restriction, x/y>2. (see figure 3). Eventually, we defined two areas (sets) were the main inequality is TRUE and were it is FALSE. Two lines intersect in point P with coordinates: (4.5;2.25).
4. Let's consider fist condition: x-y<2. x-y=2 is a boundary. (see figure 4). As we can see all y,x that satisfies the fist condition lie in "green-TRUE" region. Therefore, the first statement is sufficient to answer the question. We should be careful and check where line x-y=2 passes point P, through left side or right side. We can put y=2.25 into x-y=2 and find that x=4.25<4.5 (left side). In other words, line x-y=2 passes y=2.25 (y-coordinate of P) early and goes above P.
5. Finally, let's check last condition: y-x<2. y-x=2 is a boundary. (see figure 5). As we can see all y,x that satisfies the second condition lie in both "green-TRUE" and "red-FALSE" regions. Thus, the second condition is insufficient.
So, answer is A.
This approach took less than 2 minutes.
Tips:
1) How fast can we draw a line, for example 3x+2y=18? Simple approach: we need two points to draw line, let's choose intersections with x- and y- axes. x=0 (intersection with y-axis) --> y=9; y=0 (intersection with x-axis) --> x=6.
2) Let's suppose we have a linear inequality, such as 38y-11x>121, suppose we've already drawn the line. How can we find what side is "true" and what side is "false"? The fastest method is just use y=0,x=-infinity. In our case, 0-(-infinity)=infinity>121 - true. Therefore, we take a left side.
See also: THIS QUESTION
That's all
Regards,
Walker

tarek99.png [ 17.04 KiB | Viewed 82751 times ]
:fyi There are two distinct ways to solve math problems: logical and visual. The approach described in this post is for those who use the visual approach. If you like imaging math problems in the visual scratchpad in your mind, you will enjoy this method. At the same time, don't be discourage if it doesn't work for you, try the logical approach instead (described by Bunuel).
If \(\frac{x}{y}>2\), is \(3x+2y<18?\)
(1) \(x-y\) is less than \(2\)
(2) \(y-x\) is less than \(2\)
1. First of all, we draw x/y>2. x/y=2 - is a boundary. (see figure 1). we should note that if one of the variables is negative and other is positive, x/y will be always negative and less than 2. Therefore, our set of x,y that satisfied x/y>2 lies between line x/y=2 and x-axis.
2. Next, we draw our main inequality: 3x+2y<18. 3x+2y=18 - is a boundary. (see figure 2).
3. Now, we should combine our main inequality with the restriction, x/y>2. (see figure 3). Eventually, we defined two areas (sets) were the main inequality is TRUE and were it is FALSE. Two lines intersect in point P with coordinates: (4.5;2.25).
4. Let's consider fist condition: x-y<2. x-y=2 is a boundary. (see figure 4). As we can see all y,x that satisfies the fist condition lie in "green-TRUE" region. Therefore, the first statement is sufficient to answer the question. We should be careful and check where line x-y=2 passes point P, through left side or right side. We can put y=2.25 into x-y=2 and find that x=4.25<4.5 (left side). In other words, line x-y=2 passes y=2.25 (y-coordinate of P) early and goes above P.
5. Finally, let's check last condition: y-x<2. y-x=2 is a boundary. (see figure 5). As we can see all y,x that satisfies the second condition lie in both "green-TRUE" and "red-FALSE" regions. Thus, the second condition is insufficient.
So, answer is A.
This approach took less than 2 minutes.
Tips:
1) How fast can we draw a line, for example 3x+2y=18? Simple approach: we need two points to draw line, let's choose intersections with x- and y- axes. x=0 (intersection with y-axis) --> y=9; y=0 (intersection with x-axis) --> x=6.
2) Let's suppose we have a linear inequality, such as 38y-11x>121, suppose we've already drawn the line. How can we find what side is "true" and what side is "false"? The fastest method is just use y=0,x=-infinity. In our case, 0-(-infinity)=infinity>121 - true. Therefore, we take a left side.
See also: THIS QUESTION
That's all
Regards,
Walker
Attachment:
tarek99.png [ 17.04 KiB | Viewed 82751 times ]


If \(\frac{x}{y} > 2\), is \(3x + 2y < 18\)?
\(\frac{x}{y}>2\) tells us that \(x\) and \(y\) are either both positive or both negative, which means that all points \((x,y)\) satisfying given inequality are either in I or III quadrant. When they are both negative (in III quadrant) inequality \(3x+2y<18\) is always true, so we should check only for I quadrant, or when both \(x\) and \(y\) are positive.
In I quadrant, as \(x\) and \(y\) are both positive, we can rewrite \(\frac{x}{y}>2\) as \(x>2y>0\) (remember \(x>0\) and \(y>0\)).
So basically question becomes: If \(x>0\) and \(y>0\) and \(x>2y>0\), is \(3x+2y<18\)?
(1) \(x-y<2\).
Subtract inequalities \(x>2y\) and \(x-y<2\) (we can do this as signs are in opposite direction) --> \(x-(x-y)>2y-2\) --> \(y<2\).
Now add inequalities \(x-y<2\) and \(y<2\) (we can do this as signs are in the same direction) --> \(x-y+y<2+2\) --> \(x<4\).
We got \(y<2\) and \(x<4\). If we take maximum values \(x=4\) and \(y=2\) and substitute in \(3x+2y<18\), we'll get \(12+4=16<18\).
Sufficient.
(2) \(y-x<2\) and \(x>2y\):
\(x=3\) and \(y=1\) --> \(3x+2y=11<18\) true.
\(x=11\) and \(y=5\) --> \(3x+2y=43<18\) false.
Not sufficient.
Answer: A.
THIS QUESTION IS DISCUSSED HERE.
Kudos
Bookmarks
walker
There is another easier method to solve such questions. Let's take the same example to illustrate the method.
given : x > 2y
so we can write x = 2y + k where k is a positive number - equation 1
Fact 1 : x - y < 2
we can rewrite this as x -y + m =2 where m is a positive number - equation 2
solving equation 1 and equation 2
y = 2 -m - k AND x = 2 - m + y = (4 -2m -k)
=> 3x + 2y = 12 - 6m -3k + 4 - 2m - 2k = 16 -8m - 5k
so, 3x + 2y = 16 -8m -5k which is less than 18
now considering fact 2
Fact 2 : y - x < 2
we can rewrite this as y -x +m = 2 - equation 3
solving equation 1 and equation 3
y = m -2 -k and x = 2m -k -4
=> 3x + 2y = 8m -5k -16 which may or may not be less than 18 (since m and k may be of any positive value)
Hence A.