Events & Promotions
|
|

GMAT Club Daily Prep
Thank you for using the timer - this advanced tool can estimate your performance and suggest more practice questions. We have subscribed you to Daily Prep Questions via email.
Customized
for You
Track
Your Progress
Practice
Pays
Not interested in getting valuable practice questions and articles delivered to your email? No problem, unsubscribe here.
 Jun 11
11:00 AM EDT
-01:00 PM EDT
TTP GMAT OnDemand gives serious students 400+ hours of expert video instruction, the full TTP course, AI support, weekly office hours, and a 715+ score guarantee—all built for elite GMAT score improvement. Jun 10
06:00 AM PDT
-06:15 PM PDT
Register for the GMAT Club Virtual MBA Spotlight Fair – the world’s premier event for serious MBA candidates. This is your chance to hear directly from Admissions Directors at nearly every Top 30 MBA program.. Jun 11
01:30 AM EDT
-02:30 AM EDT
At one point, she believed GMAT wasn’t for her. After scoring 595, self-doubt crept in and she questioned her potential. But instead of quitting, she made the right strategic changes. The result? A remarkable comeback to 695. Check out how Saakshi did it. Jun 13
12:30 AM EDT
-01:00 AM EDT
Struggling to find the right strategies to score a 99 %ile on GMAT Focus? Riya (GMAT 715) boosted her score by 100-points in just 15 days! Discover how the right mentorship, tailored strategies, and an unwavering mindset can transform your GMAT prep. Jun 16
03:00 PM PDT
-04:00 PM PDT
Free- full-length test + 15 concept videos + 150+ short videos + study plan! Jun 22
07:30 PM EDT
-09:30 PM EDT
Master the GMAT with expert live instruction, a personalized study plan, and real-time support. Includes 40 hours of online classes plus 6 months of access to the TTP GMAT OnDemand video course. Class date: Mon/Wed June 22, 2026 →August 26, 2026


Kudos
Bookmarks

D
Be sure to select an answer first to save it in the Error Log before revealing the correct answer (OA)!
Difficulty:
 45%
(medium)
45%
(medium)
Question Stats:
66% (01:32) correct 34%
(01:32)
wrong
based on 745
sessions
34%
(01:32)
wrong
based on 745
sessions
History
Date
Time
Result
Not Attempted Yet
[header3]Tough and Tricky questions: Percents.[\header3]
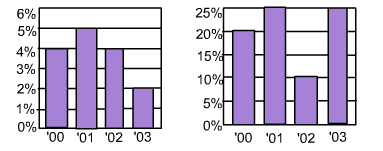
The graph on the left shows the annual revenue growth of Company X over the prior year’s revenue. The graph on the right shows the tax rate as a percent of revenue. In which year did Company X pay the greatest amount in taxes?
A. 2000
B. 2001
C. 2002
D. 2003
E. 2004
Kudos for a correct solution.

2014-12-30_1903.png [ 7.25 KiB | Viewed 12738 times ]
The graph on the left shows the annual revenue growth of Company X over the prior year’s revenue. The graph on the right shows the tax rate as a percent of revenue. In which year did Company X pay the greatest amount in taxes?
A. 2000
B. 2001
C. 2002
D. 2003
E. 2004
Kudos for a correct solution.
Attachment:
2014-12-30_1903.png [ 7.25 KiB | Viewed 12738 times ]


Kudos
Bookmarks
It seems there is an attachment missing.


