Events & Promotions
|
|

GMAT Club Daily Prep
Thank you for using the timer - this advanced tool can estimate your performance and suggest more practice questions. We have subscribed you to Daily Prep Questions via email.
Customized
for You
Track
Your Progress
Practice
Pays
Not interested in getting valuable practice questions and articles delivered to your email? No problem, unsubscribe here.
 Apr 25
12:30 AM EDT
-01:30 AM EDT
At one point, she believed GMAT wasn’t for her. After scoring 595, self-doubt crept in and she questioned her potential. But instead of quitting, she made the right strategic changes. The result? A remarkable comeback to 695. Check out how Saakshi did it. Apr 26
01:30 AM EDT
-02:30 AM EDT
Learn how Keshav, a Chartered Accountant, scored an impressive 705 on GMAT in just 30 days with GMATWhiz's expert guidance. In this video, he shares preparation tips and strategies that worked for him, including the mock, time management, and more. Apr 26
10:00 AM EDT
-11:00 AM EDT
The Target Test Prep course represents a quantum leap forward in GMAT preparation, a radical reinterpretation of the way that students should study. Try before you buy with a 5-day, full-access trial of the course for FREE! Apr 27
11:00 AM EDT
-12:00 PM EDT
Prefer video-based learning? The Target Test Prep OnDemand course is a one-of-a-kind video masterclass featuring 400 hours of lecture-style teaching by Scott Woodbury-Stewart, founder of Target Test Prep and one of the most accomplished GMAT instructors Apr 28
08:00 AM PDT
-11:00 AM PDT
Whether you are just beginning your MBA journey or fine-tuning your path to a 700+ score, GMAT Day is designed to give you a competitive edge. May 01
11:00 AM PDT
-12:00 PM PDT
Free- full-length test + 15 concept videos + 150+ short videos + study plan!

Originally posted by EgmatQuantExpert on 23 Jan 2019, 03:57.
Last edited by EgmatQuantExpert on 11 Feb 2019, 01:34, edited 2 times in total.
Last edited by EgmatQuantExpert on 11 Feb 2019, 01:34, edited 2 times in total.
Kudos
Bookmarks
Everything you need to know about Tree Structures

Objective of the article
- • The primary objective of this article is to explain the use of Visualizing the information given in a question and representing it in the form of a Tree Diagram.
• This article is helpful for those who have a basic understanding of Percent, Sets and Elements.
• After going through the article, one will be able to solve various questions on Sets, Probability, Percent and many more word problems simply by representing the given information in the form of a Tree Structure.
Agenda of the Article
- • In this article, we will solve 2 examples to learn the application of solving a question using a tree structure. First, we will see how to understand the given information and then represent the given information in the form of a Tree Structure with appropriate branching.
Question 1
720 people have attended a guest lecture, which was open for only students and faculty, conducted by an MBA graduate. The number of females, who attended the lecture is half the number of males, who attended the lecture. There were four times as many students as faculty at the lecture. If \(\frac{2}{3}^{rd}\) of the faculty were males, then how many female students have attended the lecture?
- A. 192
B. 240
C. 288
D. 384
E. 432
Understanding the Question
In this question, we are given that,
- • A guest lecture conducted by an MBA graduate was attended by a total of 720 people
• And, only students and faculty were allowed to attend this lecture
- o We also have information that the number of students, who attended the lecture is equal to 4 times the number of faculty who attended the lecture.
- Among the total number of faculty, who attended the lecture, \(\frac{2}{3}^{rd}\) were males
And, the total number of females, who attended the lecture were half the total number of males
This is all the information that we have, and we are asked to find out the number of female students who attended the lecture.
Set Up the Tree Diagram
Now that we have understood all the information that is given to us, let’s try to set up a Tree Diagram with proper branching
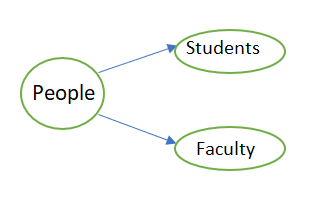
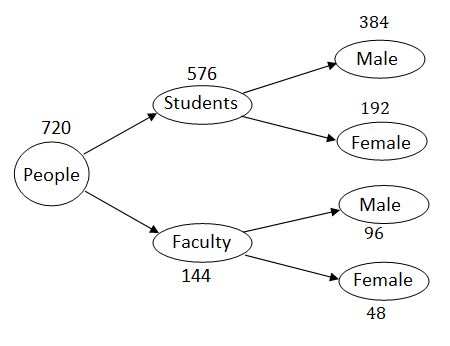
- • We typically start with the main group, which in this case is the people who attended the guest lecture.
- o This group of people is sub-divided into students and faculty, since, these are only set of people who are allowed to attend the lecture.
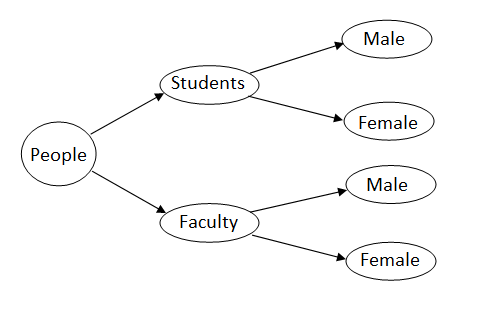
- Now, we need to account for one more category of division, that is male and female. So, both the groups, students and faculty, are sub-divided into male and female.
Let us assume that,
- • The number of Students = S
- o The number of female students = \(F_S\), and the number of male students = \(M_S\)
• Similarly, the number of faculty = F
- o The number of female faculty = \(F_F\) and the number of male faculty = \(M_F\)
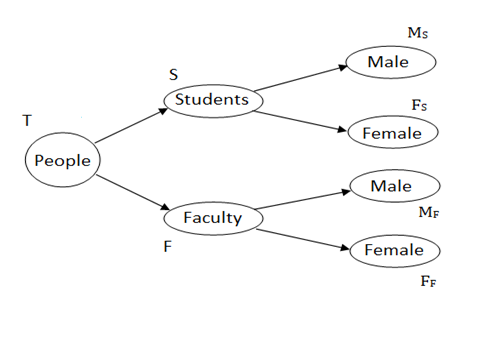
With this we have accounted space for all the branches listed in the question.
Establish Relations
The next step is to establish relation between each and every branch with its stem.
- • Let’s start with the trunk, that is, people who attended the guest lecture
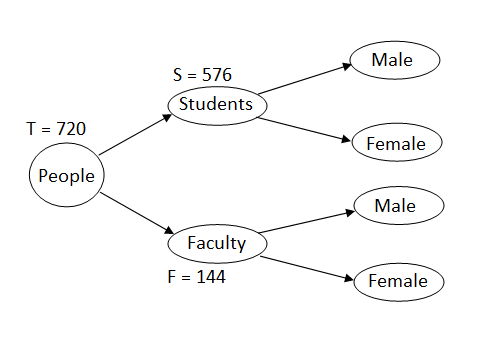
• From the diagram we can see that the total number of people(T) = the number of students(S) + the number of faculty(F), which is equal to 720
- o T = S + F = 720......... (1)
• And from the given information, we know that S = 4 * F .......... (2)
• Solving equations (1) and (2), we get
- o 4F + F =720, which implies, F = 144
o Thus, S = 720 – 144 = 576
Now that we know the number of students and the number of faculty, let’s find how many of them are male and how many are female.
- • From the Diagram, we can see that, the total number of females = \(F_F + F_S\)
- o As per the question statement we need to find the value of \(F_S\)
o Thus, we need to know the values of \(F_F\) and the total number of females to find \(F_S\)
To find \(F_F\)
- • From the Diagram, we can see that, \(F = M_F + F_F\)
• And, from the given information, we get, \(M_F = \frac{2F}{3} = 2*\frac{144}{3} = 96\)
- o Thus, \(F_F = 144 – 96 = 48\)
To find the total number of females
- • We are told that the number of females = \(\frac{1}{2}\) * the number of males
• And from the diagram, we can infer that total number of females + total number of males = 720
- o Using the above two relations, we get,
- Total number of females + 2 * total number of females = 720
Which implies that the total number of females = \(\frac{720}{3} = 240\)
Therefore, \(F_S\) = total number of females - \(F_F\) = 240 – 48 = 192

Now, let’s apply the learnings from this question to solve one more question, where we have more branches.
Question 2
In a law firm, \(\frac{1}{4}^{th}\) of the total employees are senior employees, who have a work experience of more than 5 years and the rest are junior employees. 60 percent of the senior employees are associates and 40% of the total employees, in the firm, are junior associates. 80% of the senior employees, who are associates, are male. If the total number of male associates is equal to the total number of female associates, in the firm, then what percentage of the junior associates, in the firm, are male?
- A. \(\frac{31}{2}\)%
B. \(\frac{62}{3}\)%
C. \(\frac{49}{2}\)%
D. \(\frac{155}{4}\)%
E. \(\frac{245}{4}\)%
Understanding the Question
In this question, we are given that,
- • In a law firm, \(\frac{1}{4}^{th}\) of the employees are senior employees and the rest are junior employees.
- o We are also told that,
- 60% of the total number of senior employees are associates, and
40% of the total employees, in the firm, are junior associates
o Then, we have another information that 80% of the senior employees, who are associates, are male
This is all the information that is given to us have, and we are asked to find out the percentage of junior associates, who are male, if the total number of male associates in the firm = the total number of female associates.
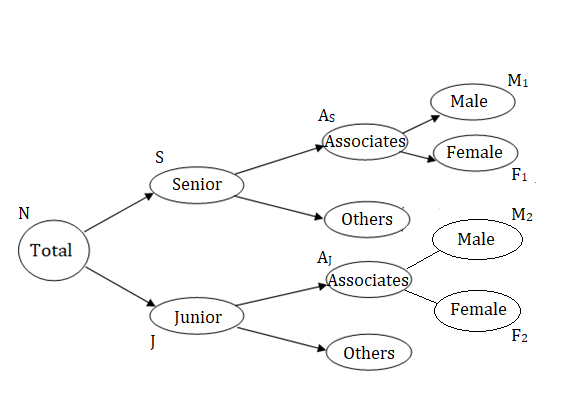
Set Up the Tree Diagram
Now that we have understood all the information that is given to us, let’s try to set up a Tree Diagram with proper branching
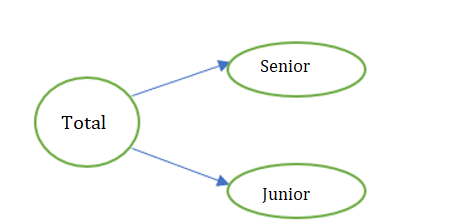
- • We typically start with the main group, which is the total employees in the law firm.
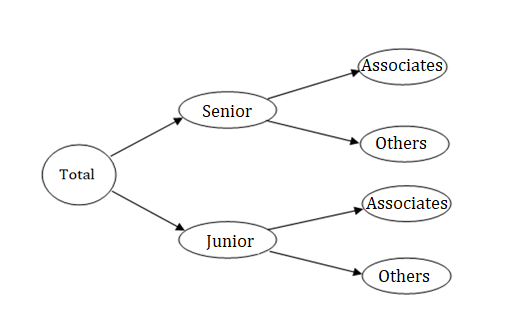
- o These are sub-divided into senior employees and junior employees.
- Now, we have information about the percentage of senior and junior employees, who are associates, and the rest of the senior and junior employees can be grouped as others.
Let us assume that,
- • The number of employees in the firm = N
- o The number of senior employees = S, and the number of junior employees = J
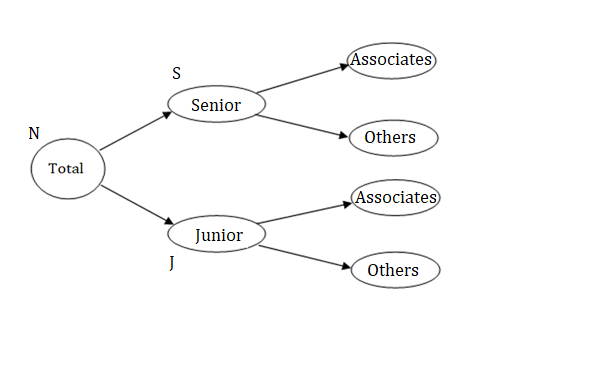
We need to account for one more division, that is the senior and junior associates, who are male and female.
Let us assume that,
- • The number of senior associates = \(A_S\), and number of junior associates = \(A_J\)
• The number of senior associates, who are male = \(M_1\) and number of senior associates, who are female = \(F_1\)
• Similarly, the number of junior associates, who are male = \(M_2\) and number of junior associates, who are female = \(F_2\)
Establish Relations
The next step is to establish relation between each and every branch with its stem.
Before, that let’s see what we are asked to find out: “what percentage of the junior associates, in the firm, are male”
- • From the diagram, we can see that the number of junior associates, who are male is represented by \(M_2\)
- o Therefore, we need to find the value of \((\frac{M_2}{A_J}) * 100\), where \(A_J = M_2 + F_2\)
Now that we know the expression, for what to be found, let’s move further.
Note that we can find the value of \((\frac{M_2}{A_J}) * 100\), if we know the values of \(M_2\) and \(F_2\) (or) \(M_2\) and \(A_J\).
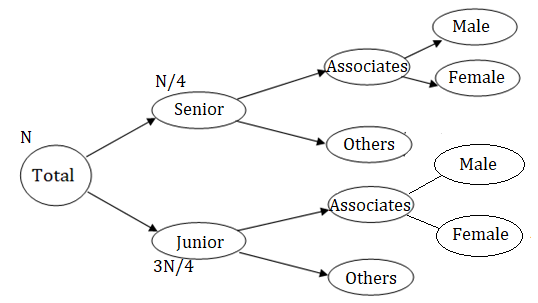
- • Let’s start with the trunk, that is the total number of employees in the firm
• From the diagram we can see that the total number of employees in the firm = the number of senior employees(S) + the number of junior employees(J)
- o N = S + J ......... (1)
• And from the given information, we know that \(S = \frac{N}{4}\).......... (2)
• Solving equations (1) and (2), we get
- o \(S = \frac{N}{4}\), and \(J = \frac{3N}{4}\)
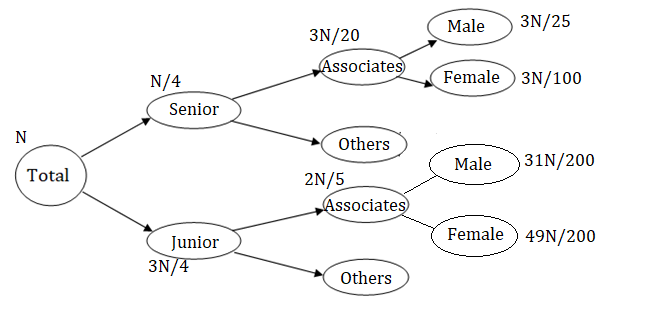
Now that we know the fraction of senior and junior employees in the firm, let’s move further to find how many of the senior and junior employees are associates.
- • From the given information, we can infer that,
- o \(A_S\) = 60% of S = \(\frac{6S}{10} = \frac{6}{10} * \frac{N}{4} = \frac{3N}{20}\)
o \(A_J\) = 40% of N = \(\frac{4N}{10} = \frac{2N}{5}\)
Now, let’s use the given information to establish more relations
- • “80% of the senior employees, who are associates, are male,”
- o Let’s translate this statement into a mathematical equation,
o From the diagram, we can see that the number of senior employees, who are associates = \(A_S\)
- Thus, 80% of \(A_S = (\frac{8}{10}) * (\frac{3N}{20}) = \frac{3N}{25} = M_1\) ................ (3)
o From the diagram, we can see that, \(A_S = M_1 + F_1 = \frac{3N}{20}\)
- Thus, \(F_1 = (\frac{3N}{20}) – (\frac{3N}{25}) = \frac{3N}{100}\)
• “Total number of male associates is equal to the total number of female associates”
- o From the diagram, we can see that,
- Total number of male associates = \(M_1 + M_2\)
Total number of female associates = \(F_1 + F_2\)
o This implies, \(M_1 + M_2 = F_1 + F_2\)
o Substituting the values of \(M_1\) and \(F_1\), we get,
- \((\frac{3N}{25}) + M_2 = (\frac{3N}{100}) + F_2\)
Thus, \(F_2 – M_2 = (\frac{3N}{25}) – (\frac{3N}{100}) = \frac{9N}{100}\) ............. (4)
And, we know, \(A_J = F_2 + M_2 = \frac{2N}{5}\) ............. (5)
• Solving equations (4) and (5), we get,
- o (4) + (5) gives, \(2F_2 = (\frac{2N}{5}) + (\frac{9N}{100}) = \frac{49N}{100}\)
o Implies, \(F_2 = \frac{49N}{200}\)
o Thus, \(M_2\) will be \((2N/5) - (49N/200) = 31N/200\)
Therefore, \(\frac{M_2}{J} * 100\) = \((\frac{31N}{200})/( \frac{2N}{5}) * 100 = (\frac{155}{4})\)%
Important Takeaways from the Article
- • Tree structures helps us to summarize and visualize all the information given in the question by representing all the possible cases by a set of branches, emanating from a main stem, which are labelled according to the given information.
• The sum of values of all the branches must be equal to the sum of its stem value.
• In questions related to percent’s, we do not need the stem value to find the percentage value of any branch or sub-branch, if we have sufficient number of relations between them

Want to read more articles like this?
Now, if you liked this article, then I am sure that you want to read some more articles like this.
To read all our article go here: Must Read Articles and Practice Questions to score Q51 !!!!
You will also get a lot of practice questions to learn from.
Happy learning.
Archived Topic
Hi there,
This topic has been closed and archived due to inactivity or violation of community quality standards. No more replies are possible here.
Where to now? Join ongoing discussions on thousands of quality questions in our Quantitative Questions Forum
Still interested in this question? Check out the "Best Topics" block below for a better discussion on this exact question, as well as several more related questions.
Thank you for understanding, and happy exploring!
Attachments
![]() TreeStructure.pdf [816.91 KiB]
TreeStructure.pdf [816.91 KiB]
Downloaded 123 times
Kudos
Bookmarks
Hey Everyone,
We've added a couple of exercise questions in which you can apply your learnings of Tree Structures.
Exercise Questions
Question 1
Question 2
Detailed solutions will be posted soon.
Happy Learning!
Regards,
Sandeep
Kudos
Bookmarks
Dear e-GMAT team,
Please provide pdf file.
thank you.
Please provide pdf file.
thank you.