Events & Promotions
|
|

GMAT Club Daily Prep
Thank you for using the timer - this advanced tool can estimate your performance and suggest more practice questions. We have subscribed you to Daily Prep Questions via email.
Customized
for You
Track
Your Progress
Practice
Pays
Not interested in getting valuable practice questions and articles delivered to your email? No problem, unsubscribe here.
 May 03
12:30 AM EDT
-01:30 AM EDT
Learn how Kamakshi achieved a GMAT 675 with an impressive 96th %ile in Data Insights. Discover the unique methods and exam strategies that helped her excel in DI along with other sections for a balanced and high score.


Dropdown 1: 12
Dropdown 2: is less than
Be sure to select an answer first to save it in the Error Log before revealing the correct answer (OA)!
Difficulty:
 65%
(hard)
65%
(hard)
Question Stats:
43% (02:27) correct 57%
(02:43)
wrong
based on 1087
sessions
57%
(02:43)
wrong
based on 1087
sessions
History
Date
Time
Result
Not Attempted Yet
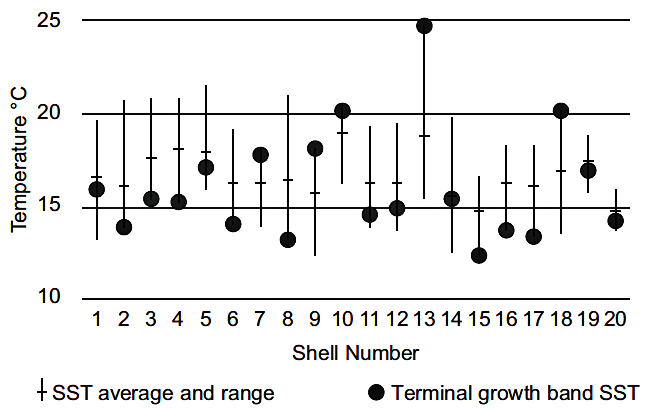
The graph shows the minimum, maximum, and mean sea-surface temperatures (with the mean indicated by —), as well as the terminal growth band SST (indicated by •) recorded for 20 sampled shells. The terminal growth band SST refers to the sea-surface temperature at the time the shell stopped growing.
Select from each drop-down menu the option that creates the most accurate statement, given the information provided.
The range of temperatures observed across all shells is approximately °C.
The median terminal growth band SST for all sampled shells is the average of the mean SSTs for all shells.
Attachment:
123.jpg [ 51.82 KiB | Viewed 9748 times ]
ShowHide Answer
Official Answer
Dropdown 1: 12
Dropdown 2: is less than
Kudos
Bookmarks
Bunuel
Official Solution:
Drop-down 1:
From the graph, we can see that the highest temperature recorded for a shell was approximately 24°C (for shell #13), while the lowest temperature recorded was approximately 12°C (for shell #15). Therefore, the range of temperatures observed across all shells is approximately 24 - 12 = 12°C.
Drop-down 2:
The median of 20 data points is calculated as the average of the two middle terms when the data is arranged in order. Observing the graph, we see that 9 terminal growth band SSTs are at or below 15°C. The 10th and 11th largest values, which determine the median, are slightly above 15°C and correspond to approximately 16°C for shells #4 and #14. Thus, the median is 16°C.
However, the mean SSTs for most shells are well above 16°C (except for shells #15 and #20, where they are slightly below 16°C). Therefore, the average of the mean SSTs, with most values well above 16°C and only two slightly below, will also be higher than 16°C. Hence, the median terminal growth band SST for all sampled shells is less than the average of the mean SSTs for all shells.
Correct answer:
Dropdown 1: "12"
Dropdown 2: "less than"

Kudos
Bookmarks
1. We are asked to fill in the blanks: "The range of temperatures observed across all shells is approximately ___°C" and "The median terminal growth band SST for all sampled shells is ___ the average of the mean SSTs for all shells."
2. Part 1. The total range of temperatures across all shells can be found by taking the longest distance between two points that can be projected from the graph onto the y-axis. This distance ends up being \(\approx 12\)°C.

3. Part 2. The median terminal growth band SST is the median of all the black points. We can split the points in two and take the lowest and highest points of the groups. Their average will be our median. This is around \(15.5\)°C.
The average of mean SSTs is the average of all the dashes. If we were to draw a line at around 16°C, then most dashes would be above it. That means the average is larger than 16°C.
So, the median terminal growth band SST for all sampled shells is less than the average of the mean SSTs for all shells.


4. Our answer will be: 12°C and "less than".

ShellTemp1.jpg [ 30.51 KiB | Viewed 5475 times ]

ShellTemp2.jpg [ 30.62 KiB | Viewed 5416 times ]

ShellTemp3.jpg [ 29.07 KiB | Viewed 5408 times ]
2. Part 1. The total range of temperatures across all shells can be found by taking the longest distance between two points that can be projected from the graph onto the y-axis. This distance ends up being \(\approx 12\)°C.
3. Part 2. The median terminal growth band SST is the median of all the black points. We can split the points in two and take the lowest and highest points of the groups. Their average will be our median. This is around \(15.5\)°C.
The average of mean SSTs is the average of all the dashes. If we were to draw a line at around 16°C, then most dashes would be above it. That means the average is larger than 16°C.
So, the median terminal growth band SST for all sampled shells is less than the average of the mean SSTs for all shells.
4. Our answer will be: 12°C and "less than".
Attachment:
ShellTemp1.jpg [ 30.51 KiB | Viewed 5475 times ]
Attachment:
ShellTemp2.jpg [ 30.62 KiB | Viewed 5416 times ]
Attachment:
ShellTemp3.jpg [ 29.07 KiB | Viewed 5408 times ]