Events & Promotions
|
|

GMAT Club Daily Prep
Thank you for using the timer - this advanced tool can estimate your performance and suggest more practice questions. We have subscribed you to Daily Prep Questions via email.
Customized
for You
Track
Your Progress
Practice
Pays
Not interested in getting valuable practice questions and articles delivered to your email? No problem, unsubscribe here.
 Apr 30
01:30 AM EDT
-02:30 AM EDT
At one point, she believed GMAT wasn’t for her. After scoring 595, self-doubt crept in and she questioned her potential. But instead of quitting, she made the right strategic changes. The result? A remarkable comeback to 695. Check out how Saakshi did it. Apr 29
12:30 AM EDT
-01:30 AM EDT
Learn how Kamakshi achieved a GMAT 675 with an impressive 96th %ile in Data Insights. Discover the unique methods and exam strategies that helped her excel in DI along with other sections for a balanced and high score. May 01
11:00 AM PDT
-12:00 PM PDT
Free- full-length test + 15 concept videos + 150+ short videos + study plan! May 03
06:30 AM PDT
-08:30 AM PDT
Verbal trouble on GMAT? Fix it NOW! Join Sunita Singhvi for a focused webinar on actionable strategies to boost your Verbal score and take your performance to the next level.


Kudos
Bookmarks

Dropdown 1: Campaign A
Dropdown 2: 5.5
Be sure to select an answer first to save it in the Error Log before revealing the correct answer (OA)!
Difficulty:
 25%
(medium)
25%
(medium)
Question Stats:
74% (01:48) correct 26%
(01:48)
wrong
based on 505
sessions
26%
(01:48)
wrong
based on 505
sessions
History
Date
Time
Result
Not Attempted Yet

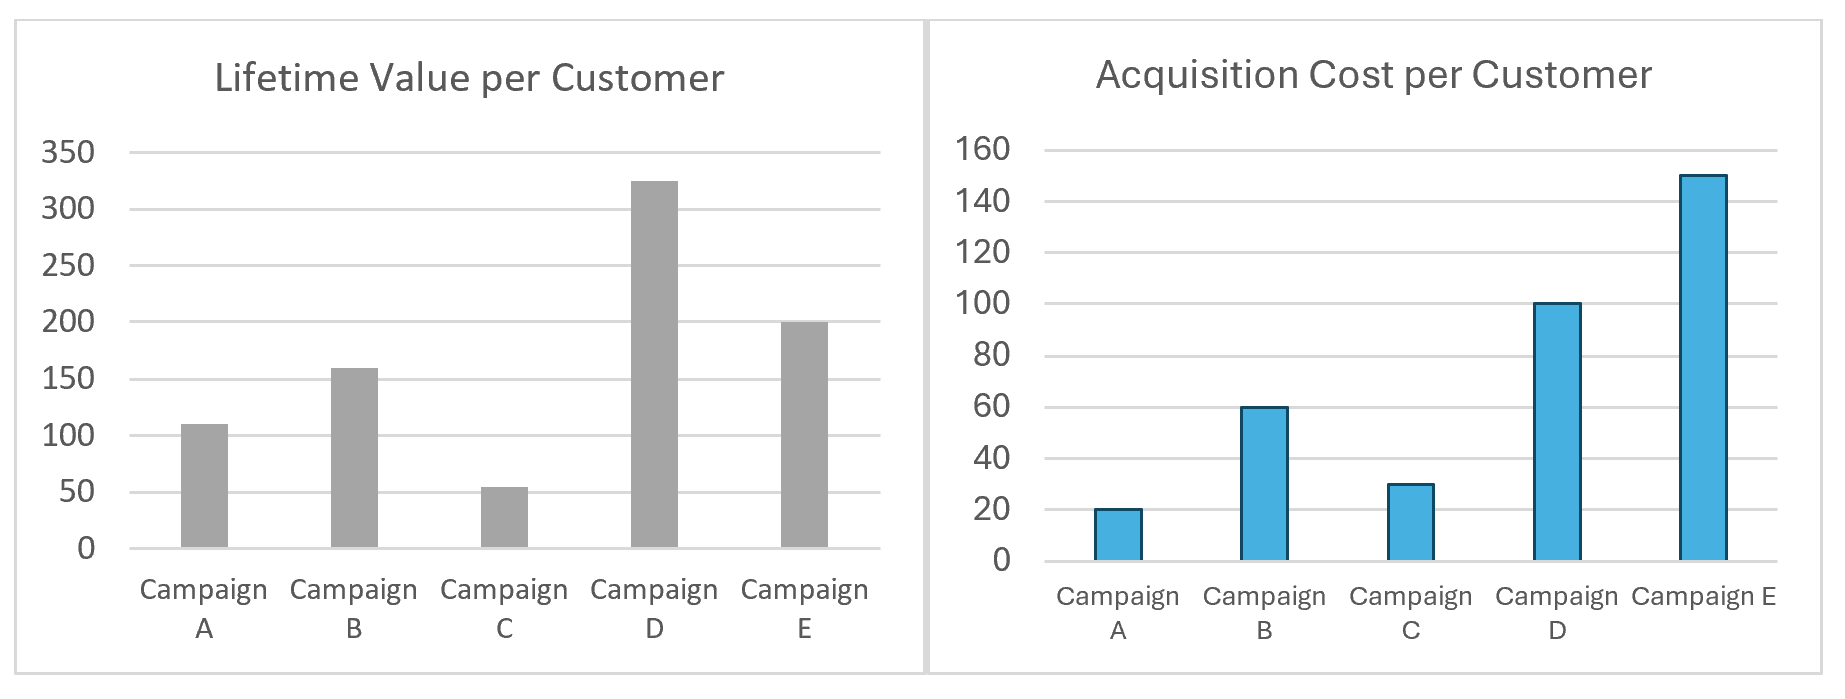
The two bar graphs show the results of five test advertising campaigns conducted by a marketing agency. The first graph displays the estimated Lifetime Value per customer (total revenue expected from a customer, in USD), and the second graph displays the Acquisition Cost per customer (cost to acquire one customer, in USD).
From each drop-down menu, select the option that creates the most accurate statement based on the information provided.
If each campaign acquired the same number of customers, the campaign with the highest ratio of Total Lifetime Value to Total Acquisition Cost is , with an approximate value of .
ShowHide Answer
Official Answer
Dropdown 1: Campaign A
Dropdown 2: 5.5
Kudos
Bookmarks
Official Solution:
Since each campaign acquired the same number of customers, the ratio of total Lifetime Value to total Acquisition Cost will be the same as the ratio per customer. So, we can compare the per-customer values directly to find the highest overall ratio.
Campaign A:
Lifetime Value ≈ 110 USD, Acquisition Cost ≈ 20 USD
Ratio = 110 / 20 = 5.5
Campaign B:
Lifetime Value ≈ 160 USD, Acquisition Cost ≈ 60 USD
Ratio = 160 / 60 ≈ 2.7
Campaign C:
Lifetime Value ≈ 50 USD, Acquisition Cost ≈ 30 USD
Ratio = 50 / 30 ≈ 1.7
Campaign D:
Lifetime Value ≈ 325 USD, Acquisition Cost ≈ 100 USD
Ratio = 325 / 100 ≈ 3.3
Campaign E:
Lifetime Value ≈ 200 USD, Acquisition Cost ≈ 150 USD
Ratio = 200 / 150 ≈ 1.3
The campaign with the highest ratio is Campaign A, with an approximate value of 5.5.
Correct answer:
Dropdown 1: "Campaign A"
Dropdown 2: "5.5"
Bunuel
Since each campaign acquired the same number of customers, the ratio of total Lifetime Value to total Acquisition Cost will be the same as the ratio per customer. So, we can compare the per-customer values directly to find the highest overall ratio.
Campaign A:
Lifetime Value ≈ 110 USD, Acquisition Cost ≈ 20 USD
Ratio = 110 / 20 = 5.5
Campaign B:
Lifetime Value ≈ 160 USD, Acquisition Cost ≈ 60 USD
Ratio = 160 / 60 ≈ 2.7
Campaign C:
Lifetime Value ≈ 50 USD, Acquisition Cost ≈ 30 USD
Ratio = 50 / 30 ≈ 1.7
Campaign D:
Lifetime Value ≈ 325 USD, Acquisition Cost ≈ 100 USD
Ratio = 325 / 100 ≈ 3.3
Campaign E:
Lifetime Value ≈ 200 USD, Acquisition Cost ≈ 150 USD
Ratio = 200 / 150 ≈ 1.3
The campaign with the highest ratio is Campaign A, with an approximate value of 5.5.
Correct answer:
Dropdown 1: "Campaign A"
Dropdown 2: "5.5"

Kudos
Bookmarks
Instead of taking the exact value, let's take approx values for simplicity and quick calculations.
Campaign A: 100/20≈ 5
Campaign B: 150/60≈ 2.5
Campaign C: not calculating as the acquisition cost is higher
Campaign D: 300/100≈ 3
Campaign E: 200/150≈ 1.3
Largest ratio: Campaign A
Value: ≈5 therefore value=5.5
Campaign A: 100/20≈ 5
Campaign B: 150/60≈ 2.5
Campaign C: not calculating as the acquisition cost is higher
Campaign D: 300/100≈ 3
Campaign E: 200/150≈ 1.3
Largest ratio: Campaign A
Value: ≈5 therefore value=5.5