Events & Promotions
|
|

GMAT Club Daily Prep
Thank you for using the timer - this advanced tool can estimate your performance and suggest more practice questions. We have subscribed you to Daily Prep Questions via email.
Customized
for You
Track
Your Progress
Practice
Pays
Not interested in getting valuable practice questions and articles delivered to your email? No problem, unsubscribe here.
 May 21
10:00 AM EDT
-11:59 PM EDT
Make the most of your break with the most realistic GMAT™ prep. Take up to $700 off select products. May 29
10:00 AM IST
-11:00 PM IST
Start your journey with a fully customized action plan and work with a dedicated mentor to achieve a 735+ score. Jun 10
06:00 AM PDT
-06:15 PM PDT
Register for the GMAT Club Virtual MBA Spotlight Fair – the world’s premier event for serious MBA candidates. This is your chance to hear directly from Admissions Directors at nearly every Top 30 MBA program..


Kudos
Bookmarks
Between 1980 and 2008, most of India’s agricultural growth came from productivity gains rather than increased use of resources. Efficiency and technical improvements contributed 66% of growth, while conventional inputs—such as land, labor, capital, and materials—accounted for 34%. Average annual productivity growth was 2.1%, though it varied across regions.
Public investment in agricultural research and higher education had the greatest impact on productivity, particularly in the northern, western, and central States. Each ₹1 invested in this area generated ₹18.34 in research benefits.
The second most impactful factor was irrigation expansion. Groundwater-well irrigation contributed more to productivity growth than canal irrigation by enabling broader access to water and allowing more land to be double cropped.
Investment in rural education had mixed effects. Where the average level of rural schooling exceeded 4.3 years, it increased productivity. Where the average level of rural schooling was below 4.3 years, it substantially reduced productivity growth and limited the effectiveness of education investments. This threshold appeared critical for adopting new agricultural practices.
International public agricultural research also supported productivity growth, though its effects could not be separated clearly from private-sector research efforts. Support services such as access to credit and farm advisory programs also expanded considerably during this period but did not show a measurable effect on productivity growth.
For each of the following statements, select Yes if it is supported by the information provided. Otherwise, select No.
| Yes | No | |
| Gujarat accounted for approximately 25% of the West region’s agricultural production value in 1980–1984. | ||
| For 2004–2008, Andhra Pradesh’s agricultural production accounted for a larger share of its region’s total than any other state’s share within their own region. | ||
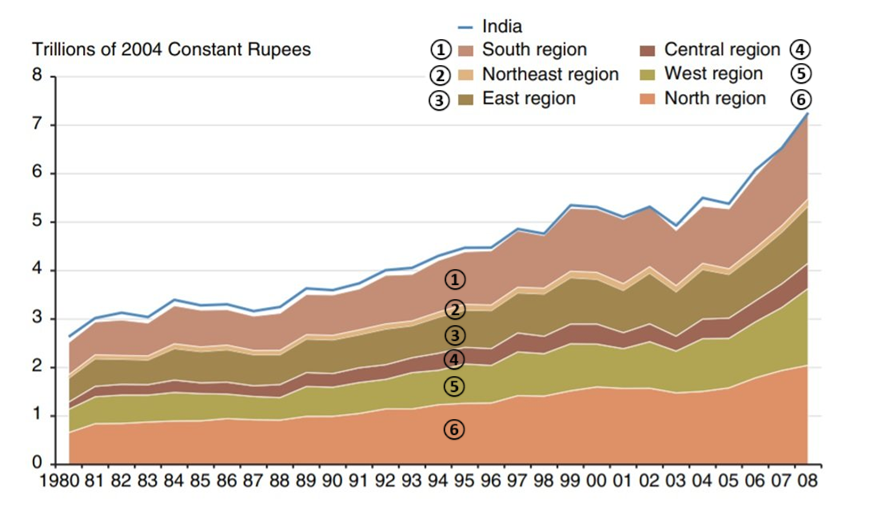
| From 1980 to 2008, the Central region (marked by 4 in the graph in Tab 2) experienced the smallest absolute increase in agricultural production among all six regions. |
ShowHide Answer
Official Answer
Gujarat accounted for approximately 25% of the West region’s agricultural production value in 1980–1984.: Yes
For 2004–2008, Andhra Pradesh’s agricultural production accounted for a larger share of its region’s total than any other state’s share within their own region.: No
From 1980 to 2008, the Central region (marked by 4 in the graph in Tab 2) experienced the smallest absolute increase in agricultural production among all six regions.: No
Kudos
Bookmarks
Official Solution:
Gujarat accounted for approximately 25% of the West region’s agricultural production value in 1980–1984.
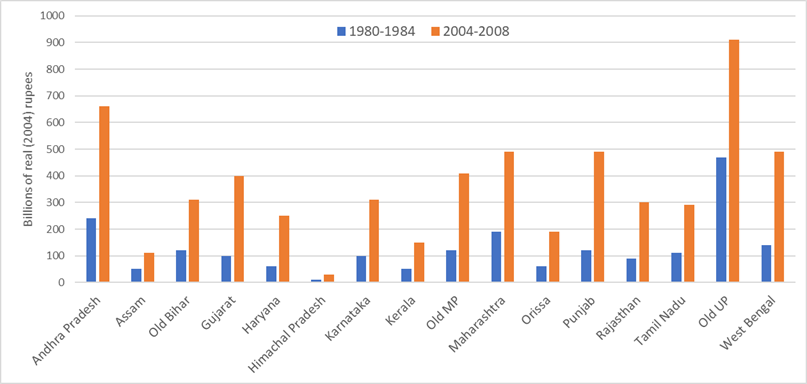
• According to Tab 2, the West region consists of Rajasthan, Gujarat, and Maharashtra. Tab 3 shows that in 1980–1984, Rajasthan contributed approximately ₹100 billion, Gujarat also contributed approximately ₹100 billion, and Maharashtra contributed approximately ₹200 billion. Therefore, Gujarat’s share of the West region’s total was approximately 100 / (100 + 100 + 200) = 1/4, or 25%, supporting the statement.
For 2004–2008, Andhra Pradesh’s agricultural production accounted for a larger share of its region’s total than any other state’s share within their own region.
• Andhra Pradesh is part of the South region (marked by 1 in the graph in Tab 2). In 2008, the South region accounted for approximately ₹1.7 trillion in agricultural production. According to Tab 3, Andhra Pradesh contributed about ₹660 billion, or roughly 40% of its region’s total. However, the Northeast region consists solely of Assam, meaning Assam accounted for 100% of its region’s production—clearly more than Andhra Pradesh’s share. Therefore, the statement is not supported.
From 1980 to 2008, the Central region (marked by 4 in the graph in Tab 2) experienced the smallest absolute increase in agricultural production among all six regions.
• According to the graph in Tab 2, the Central region (marked by 4) shows relatively modest growth in agricultural production between 1980 and 2008. However, the Northeast region (marked by 2) displays an even smaller absolute increase in production over the same period. Therefore, the statement is not supported.
Correct answer:
Gujarat accounted for approximately 25% of the West region’s agricultural production value in 1980–1984. "Yes"
For 2004–2008, Andhra Pradesh’s agricultural production accounted for a larger share of its region’s total than any other state’s share within their own region. "No"
From 1980 to 2008, the Central region (marked by 4 in the graph in Tab 2) experienced the smallest absolute increase in agricultural production among all six regions. "No"
Bunuel
Gujarat accounted for approximately 25% of the West region’s agricultural production value in 1980–1984.
• According to Tab 2, the West region consists of Rajasthan, Gujarat, and Maharashtra. Tab 3 shows that in 1980–1984, Rajasthan contributed approximately ₹100 billion, Gujarat also contributed approximately ₹100 billion, and Maharashtra contributed approximately ₹200 billion. Therefore, Gujarat’s share of the West region’s total was approximately 100 / (100 + 100 + 200) = 1/4, or 25%, supporting the statement.
For 2004–2008, Andhra Pradesh’s agricultural production accounted for a larger share of its region’s total than any other state’s share within their own region.
• Andhra Pradesh is part of the South region (marked by 1 in the graph in Tab 2). In 2008, the South region accounted for approximately ₹1.7 trillion in agricultural production. According to Tab 3, Andhra Pradesh contributed about ₹660 billion, or roughly 40% of its region’s total. However, the Northeast region consists solely of Assam, meaning Assam accounted for 100% of its region’s production—clearly more than Andhra Pradesh’s share. Therefore, the statement is not supported.
From 1980 to 2008, the Central region (marked by 4 in the graph in Tab 2) experienced the smallest absolute increase in agricultural production among all six regions.
• According to the graph in Tab 2, the Central region (marked by 4) shows relatively modest growth in agricultural production between 1980 and 2008. However, the Northeast region (marked by 2) displays an even smaller absolute increase in production over the same period. Therefore, the statement is not supported.
Correct answer:
Gujarat accounted for approximately 25% of the West region’s agricultural production value in 1980–1984. "Yes"
For 2004–2008, Andhra Pradesh’s agricultural production accounted for a larger share of its region’s total than any other state’s share within their own region. "No"
From 1980 to 2008, the Central region (marked by 4 in the graph in Tab 2) experienced the smallest absolute increase in agricultural production among all six regions. "No"


