Last visit was: 28 Apr 2026, 20:52 It is currently 28 Apr 2026, 20:52
Close
GMAT Club Daily Prep
Thank you for using the timer - this advanced tool can estimate your performance and suggest more practice questions. We have subscribed you to Daily Prep Questions via email.

Customized
for You

we will pick new questions that match your level based on your Timer History

Track
Your Progress

every week, we’ll send you an estimated GMAT score based on your performance

Practice
Pays

we will pick new questions that match your level based on your Timer History
Not interested in getting valuable practice questions and articles delivered to your email? No problem, unsubscribe here.
Close
Request Expert Reply
Confirm Cancel
Events & Promotions
User avatar
Bunuel
User avatar
Math Expert
Joined: 02 Sep 2009
Last visit: 28 Apr 2026
Posts: 109,950
Own Kudos:
Given Kudos: 105,927
Products:
Expert
Expert reply
Active GMAT Club Expert! Tag them with @ followed by their username for a faster response.
Posts: 109,950
Kudos: 811,823
Kudos
Add Kudos
Bookmarks
Bookmark this Post
User avatar
Aditya997
Joined: 08 Jan 2024
Last visit: 15 Nov 2025
Posts: 3
Own Kudos:
3
 [2]
Given Kudos: 10
Posts: 3
Kudos: 3
 [2]
2
Kudos
Add Kudos
Bookmarks
Bookmark this Post
Bunuel could please help out here,
how are you getting these values from the graph?
for the first question i got 3.3 and 3 (which are quite close from what is given in the answer but while solving don't come close to the answer).
also for the second one i got 0.8 and 1.7 which again don't match the answer.
User avatar
Bunuel
User avatar
Math Expert
Joined: 02 Sep 2009
Last visit: 28 Apr 2026
Posts: 109,950
Own Kudos:
Given Kudos: 105,927
Products:
Expert
Expert reply
Active GMAT Club Expert! Tag them with @ followed by their username for a faster response.
Posts: 109,950
Kudos: 811,823
Kudos
Add Kudos
Bookmarks
Bookmark this Post
Aditya997
Bunuel could please help out here,
how are you getting these values from the graph?
for the first question i got 3.3 and 3 (which are quite close from what is given in the answer but while solving don't come close to the answer).
also for the second one i got 0.8 and 1.7 which again don't match the answer.

We need to find approximate answers. Even if you estimate the way you did, you would still arrive at the correct answer because the options are well spread apart.
User avatar
Nestor_Izuit
Joined: 13 Nov 2023
Last visit: 31 Jul 2025
Posts: 6
Own Kudos:
Given Kudos: 4
Posts: 6
Kudos: 2
Kudos
Add Kudos
Bookmarks
Bookmark this Post
I don’t quite agree with the solution. graph is not clear, it's hard to see the scale for corn price, in question 1 I thought ethanol price is 3,5 and corn 2,7 so I get 30% and not 15%. Probably I'm wrong but in any case it's barely readible from this graph
User avatar
Bunuel
User avatar
Math Expert
Joined: 02 Sep 2009
Last visit: 28 Apr 2026
Posts: 109,950
Own Kudos:
Given Kudos: 105,927
Products:
Expert
Expert reply
Active GMAT Club Expert! Tag them with @ followed by their username for a faster response.
Posts: 109,950
Kudos: 811,823
Kudos
Add Kudos
Bookmarks
Bookmark this Post
Nestor_Izuit
I don’t quite agree with the solution. graph is not clear, it's hard to see the scale for corn price, in question 1 I thought ethanol price is 3,5 and corn 2,7 so I get 30% and not 15%. Probably I'm wrong but in any case it's barely readible from this graph

Ethanol and gasoline costs are shown on the left vertical axis, and corn costs are shown on the right vertical axis.

The ethanol price is represented by the black line, which clearly lies entirely below the $3.50 mark (left vertical axis).

The corn prices are represented by the red line, with the lowest point around $3 (right vertical axis).
User avatar
ektalakra
Joined: 29 Jul 2024
Last visit: 26 Mar 2026
Posts: 38
Own Kudos:
16
 [1]
Given Kudos: 84
Posts: 38
Kudos: 16
 [1]
1
Kudos
Add Kudos
Bookmarks
Bookmark this Post
Doubt for 2nd part of the question:
i took the initial reading (beginning of the period -2008) as 0.8 (approx.) and for reading " at the end of the period" as the reading Jan 17 which is coming approximately 1.8 final reading almost twice of initial reading....could you pls help me identify what I am missing.
Bunuel
Official Solution:


Drop-down 1:

The highest cost for ethanol was at the beginning of 2013, reaching approximately $3.20–$3.30 per gallon, while the lowest cost for corn was at the end of 2015, at approximately $2.90–$3.00 per bushel. Therefore, the highest cost for ethanol was approximately 20–40 cents greater than the lowest cost of corn.

Drop-down 2:

At the beginning of 2008, the cost of gasoline was approximately $0.60 per gallon, while by the end of 2016, it had increased to approximately $1.70, meaning the price approximately tripled.


Correct answer:

Dropdown 1: "30 cents"

Dropdown 2: "triple "
User avatar
Bunuel
User avatar
Math Expert
Joined: 02 Sep 2009
Last visit: 28 Apr 2026
Posts: 109,950
Own Kudos:
Given Kudos: 105,927
Products:
Expert
Expert reply
Active GMAT Club Expert! Tag them with @ followed by their username for a faster response.
Posts: 109,950
Kudos: 811,823
Kudos
Add Kudos
Bookmarks
Bookmark this Post
ektalakra
Doubt for 2nd part of the question:
i took the initial reading (beginning of the period -2008) as 0.8 (approx.) and for reading " at the end of the period" as the reading Jan 17 which is coming approximately 1.8 final reading almost twice of initial reading....could you pls help me identify what I am missing.


You’re right that on the left axis the gasoline line in early could 2008 look close to 0.8, and by the end of the period it’s around 1.7 (actually 0.6 and 1.7). Even if you read it that way, when you compare the options (half, equal, triple), “triple” is still the closest match. It’s not equal and it’s not half, so among the given choices, “triple” is the best fit.
User avatar
Robo_123
Joined: 30 Jan 2024
Last visit: 21 Feb 2026
Posts: 69
Own Kudos:
Given Kudos: 45
Location: India
Concentration: Marketing, Finance
GMAT Focus 1: 645 Q84 V81 DI80
GPA: 7.8
GMAT Focus 1: 645 Q84 V81 DI80
Posts: 69
Kudos: 20
Kudos
Add Kudos
Bookmarks
Bookmark this Post
The lowest point for corn per bushel on the right axis is above 3. It is around 3.5, why are we saying it is lower than that?
Bunuel


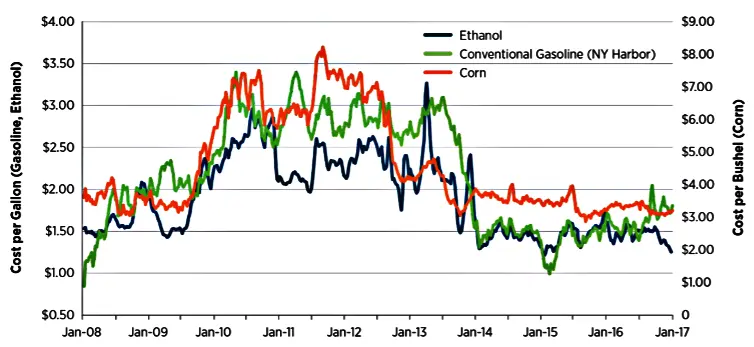
The graph compares the cost of ethanol and gasoline in the United States with the cost of corn over a period of time. Ethanol and gasoline costs are shown on the left vertical axis, and corn costs are shown on the right vertical axis.

Select from each drop-down menu the option that creates the most accurate statement, given the information provided.


The highest cost of ethanol per gallon was approximately greater than the lowest cost of corn per bushel.

At the end of the period shown in the graph, the cost per gallon of gasoline was approximately of what it was at the beginning of the period.
User avatar
Bunuel
User avatar
Math Expert
Joined: 02 Sep 2009
Last visit: 28 Apr 2026
Posts: 109,950
Own Kudos:
Given Kudos: 105,927
Products:
Expert
Expert reply
Active GMAT Club Expert! Tag them with @ followed by their username for a faster response.
Posts: 109,950
Kudos: 811,823
Kudos
Add Kudos
Bookmarks
Bookmark this Post
Robo_123
The lowest point for corn per bushel on the right axis is above 3. It is around 3.5, why are we saying it is lower than that?


Check the blue line:

Attachment:
GMAT-Club-Forum-irdyxbj6.png
GMAT-Club-Forum-irdyxbj6.png [ 119.53 KiB | Viewed 1211 times ]
Moderators:
Math Expert
109950 posts
Founder
43171 posts