Events & Promotions
|
|

GMAT Club Daily Prep
Thank you for using the timer - this advanced tool can estimate your performance and suggest more practice questions. We have subscribed you to Daily Prep Questions via email.
Customized
for You
Track
Your Progress
Practice
Pays
Not interested in getting valuable practice questions and articles delivered to your email? No problem, unsubscribe here.
 May 21
10:00 AM EDT
-11:59 PM EDT
Make the most of your break with the most realistic GMAT™ prep. Take up to $700 off select products. May 29
10:00 AM IST
-11:00 PM IST
Start your journey with a fully customized action plan and work with a dedicated mentor to achieve a 735+ score. Jun 10
06:00 AM PDT
-06:15 PM PDT
Register for the GMAT Club Virtual MBA Spotlight Fair – the world’s premier event for serious MBA candidates. This is your chance to hear directly from Admissions Directors at nearly every Top 30 MBA program..


Kudos
Bookmarks
In 1999, nearly all households in Country X purchased salty snacks. About 91% of households bought potato chips, purchasing an average of 9.8 pounds and spending roughly $26 over the year. A broader category—all chips (including potato, corn, and tortilla)—was purchased by 95.5% of households, with average annual purchases of 16.3 pounds. Other salty snacks, such as pretzels, cheese puffs, microwave popcorn, and packaged or bulk nuts, were purchased by 96.8% of households.
Considering all salty snacks, 99.2% of households made purchases in 1999. Among those who did, the average household bought 31.8 pounds and spent approximately $76.40. On a per-person basis, the average quantity purchased was 14.5 pounds.
Three key points emerge:
• Salty snack consumption was nearly universal, so almost all households would have been affected by a per-pound tax.
• Purchase quantities and spending varied systematically by household characteristics and demographics.
• Despite this variation, salty snacks represented a relatively small portion of household spending.
For each of the following, select Supported if it is a statistical statement supported by the information in Tab 2. Otherwise, select Not supported.
| Supported | Not supported | |
| Each household that purchased salty snacks in 1999 purchased more than 1 pound. | ||
| Approximately one-fifth of all households consumed 10 pounds or fewer of salty snacks in 1999. | ||
| The median range of salty snack consumption is approximately 70 pounds greater than the modal range of salty snack consumption. |
ShowHide Answer
Official Answer
Each household that purchased salty snacks in 1999 purchased more than 1 pound.: Not supported
Approximately one-fifth of all households consumed 10 pounds or fewer of salty snacks in 1999.: Supported
The median range of salty snack consumption is approximately 70 pounds greater than the modal range of salty snack consumption.: Not supported
Kudos
Bookmarks
Official Solution:
• Each household that purchased salty snacks in 1999 purchased more than 1 pound.
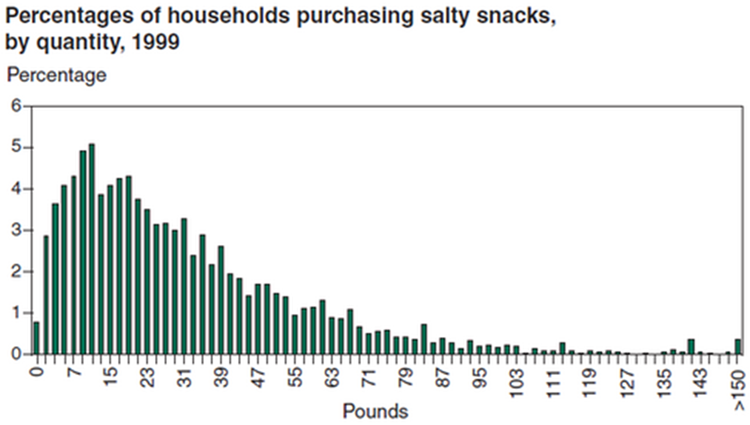
The histogram shows that some households fall into the 0–2 pound range. While we don’t know the exact breakdown within that bar, it's entirely possible that some households purchased 1 pound or less. Not supported.
• Approximately one-fifth of all households consumed 10 pounds or fewer of salty snacks in 1999.
The bars covering 0–10 pounds (from the first to the sixth bars) collectively account for close to 20% of all households, based on the percentages shown in the histogram. Supported.
• The median range of salty snack consumption is approximately 70 pounds greater than the modal range of salty snack consumption.
As stated in Tab 2, the modal range is 10–12 pounds. The median represents the midpoint of the distribution—where 50% of households purchased less and 50% purchased more. A median that is approximately 70 pounds higher than the modal range would place the median around 80 pounds, which would mean that 50% of households purchased less than 80 pounds and 50% more than 80 pounds. This is clearly incorrect, as the graph shows that far fewer households purchased more than 80 pounds than purchased less. Not supported.
Correct answer:
Each household that purchased salty snacks in 1999 purchased more than 1 pound. "Not supported"
Approximately one-fifth of all households consumed 10 pounds or fewer of salty snacks in 1999. "Supported"
The median range of salty snack consumption is approximately 70 pounds greater than the modal range of salty snack consumption. "Not supported"
Bunuel
• Each household that purchased salty snacks in 1999 purchased more than 1 pound.
The histogram shows that some households fall into the 0–2 pound range. While we don’t know the exact breakdown within that bar, it's entirely possible that some households purchased 1 pound or less. Not supported.
• Approximately one-fifth of all households consumed 10 pounds or fewer of salty snacks in 1999.
The bars covering 0–10 pounds (from the first to the sixth bars) collectively account for close to 20% of all households, based on the percentages shown in the histogram. Supported.
• The median range of salty snack consumption is approximately 70 pounds greater than the modal range of salty snack consumption.
As stated in Tab 2, the modal range is 10–12 pounds. The median represents the midpoint of the distribution—where 50% of households purchased less and 50% purchased more. A median that is approximately 70 pounds higher than the modal range would place the median around 80 pounds, which would mean that 50% of households purchased less than 80 pounds and 50% more than 80 pounds. This is clearly incorrect, as the graph shows that far fewer households purchased more than 80 pounds than purchased less. Not supported.
Correct answer:
Each household that purchased salty snacks in 1999 purchased more than 1 pound. "Not supported"
Approximately one-fifth of all households consumed 10 pounds or fewer of salty snacks in 1999. "Supported"
The median range of salty snack consumption is approximately 70 pounds greater than the modal range of salty snack consumption. "Not supported"


