Thank you for using the timer - this advanced tool can estimate your performance and suggest more practice questions. We have subscribed you to Daily Prep Questions via email.
Customized for You
we will pick new questions that match your level based on your Timer History
Track Your Progress
every week, we’ll send you an estimated GMAT score based on your performance
Practice Pays
we will pick new questions that match your level based on your Timer History
Not interested in getting valuable practice questions and articles delivered to your email? No problem, unsubscribe here.
Thank you for using the timer!
We noticed you are actually not timing your practice. Click the START button first next time you use the timer.
There are many benefits to timing your practice, including:
We’ve worked incredibly hard to build TTP into the best test prep experience possible, and it would mean a lot to us to win Newsweek’s 2026 Readers’ Choice Award for Best Test Prep. If TTP has helped you, we’d be incredibly grateful for your vote.
What does test anxiety really look like on the GMAT? For many test takers, it does not look like a panic attack. Instead, it shows up as brain fog, rereading, negative comparisons, mental noise....
Top scores are possible when you enroll in a powerful EA course, taught live online + 6 months access to TTP OnDemand video courses included! Perfect class schedule and easy course access for working professionals. Class starts Sundays Sept. 6, 2026.
Meet AdComs and explore top Master’s programs - MiM, MiF, MSc, MSBA and more. - Application Fee Waivers - Free 1-Week of GMAT Club Tests: - Master's Application Toolkit - Grand Prize Giveaway
Elite scores are possible when you enroll in a powerful GMAT course, taught live online + 6 months access to TTP OnDemand video courses included! Class starts Tues/Thurs Sept. 15, 2026 - Nov. 15, 2027, 7:00pm-9:00pm EST
Boost your GMAT score in less than one month in a live online class + 6 months access to TTP OnDemand video courses included! Class starts Mon, Tues, Wed, Thur, Fri Sept. 21, 2026 - Oct. 9, 2027, 7:00pm-10:00pm EST
Dropdown 1: males who never smoked
Dropdown 2: approximately doubled
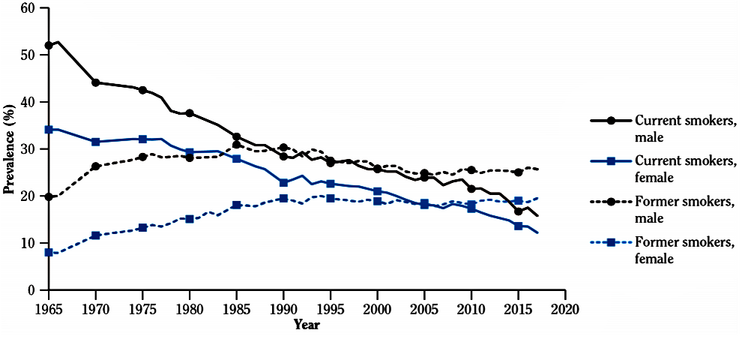
The graph above illustrates trends in the prevalence of current and former cigarette smoking among adults aged 18 and older, categorized by gender.
According to the information in the chart, the most accurate statement regarding the adult smoker population from 1965 to 2015 is that the percentage of had over the fifty-year period.
The graph above illustrates trends in the prevalence of current and former cigarette smoking among adults aged 18 and older, categorized by gender.
According to the information in the chart, the most accurate statement regarding the adult smoker population from 1965 to 2015 is that the percentage of had over the fifty-year period.
Show more
Let's evaluate the change in the four categories given in the first drop-down.
• The percentage of current female smokers decreased from approximately 35% to 15%, which is more than twice. Since this option is not available in the second drop-down, we eliminate it.
• The percentage of former male smokers increased from approximately 20% to 25%, which is a 25% increase. Since this option is not available in the second drop-down, we eliminate it.
• The percentage of females who never smoked increased from approximately 100% - (35% + 8%) = 57% to 100% - (13% + 20%) = 67%, which is about a 20% increase. Since this option is not available in the second drop-down, we eliminate it.
• The percentage of males who never smoked increased from approximately 100% - (52% + 20%) = 28% to 100% - (18% + 25%) = 57%, which is approximately doubling. Since this option is available in the second drop-down, this is the correct answer.
The graph above illustrates trends in the prevalence of current and former cigarette smoking among adults aged 18 and older, categorized by gender.
According to the information in the chart, the most accurate statement regarding the adult smoker population from 1965 to 2015 is that the percentage of had over the fifty-year period.
Let's evaluate the change in the four categories given in the first drop-down.
• The percentage of current female smokers decreased from approximately 35% to 15%, which is more than twice. Since this option is not available in the second drop-down, we eliminate it.
• The percentage of former male smokers increased from approximately 20% to 25%, which is a 25% increase. Since this option is not available in the second drop-down, we eliminate it.
• The percentage of females who never smoked increased from approximately 100% - (35% + 8%) = 57% to 100% - (13% + 20%) = 67%, which is about a 20% increase. Since this option is not available in the second drop-down, we eliminate it.
• The percentage of males who never smoked increased from approximately 100% - (52% + 20%) = 28% to 100% - (18% + 25%) = 57%, which is approximately doubling. Since this option is available in the second drop-down, this is the correct answer.
Originally posted by Bunuel on 04 Apr 2025, 03:17.
Last edited by Bunuel on 07 Jun 2026, 13:41, edited 1 time in total.
Kudos
Add Kudos
Bookmarks
Bookmark this Post
tanmaygmat2425
Bunuelbb How can we do 100-(former+current). There could be certain overlap between former and current smokers?
Show more
No, there's no overlap between former and current smokers. These categories are mutually exclusive, someone is either a current smoker, a former smoker, or has never smoked. So it's valid to calculate the percentage of never smokers as 100% minus the sum of current and former smokers.
Bunuel thanks much for your reply but how do we get this part "there's no overlap between former and current smokers" from the question stem
Bunuel
tanmaygmat2425
Bunuelbb How can we do 100-(former+current). There could be certain overlap between former and current smokers?
No, there's no overlap between former and current smokers. These categories are mutually exclusive—someone is either a current smoker, a former smoker, or has never smoked. So it's valid to calculate the percentage of never smokers as 100% minus the sum of current and former smokers.
Originally posted by Bunuel on 04 Apr 2025, 03:25.
Last edited by Bunuel on 07 Jun 2026, 13:42, edited 1 time in total.
Kudos
Add Kudos
Bookmarks
Bookmark this Post
tanmaygmat2425
Bunuel thanks much for your reply but how do we get this part "there's no overlap between former and current smokers" from the question stem
Show more
We can apply basic logic here: a person can’t be both a current and a former smoker at the same time. If someone is still smoking, they’re current, if they’ve quit, they’re former. So by definition, the categories don’t overlap, and it’s valid to do 100 - (current + former) to get the percentage who never smoked.
Given that percentage of current female smokers decreased from approximately 35% to 15%, it a decrease by approximately 20% over the 50 year period, which is also one of the options. Why is this not a correct answer?
Bunuel
Official Solution:
Bunuel
The graph above illustrates trends in the prevalence of current and former cigarette smoking among adults aged 18 and older, categorized by gender.
According to the information in the chart, the most accurate statement regarding the adult smoker population from 1965 to 2015 is that the percentage of had over the fifty-year period.
Let's evaluate the change in the four categories given in the first drop-down.
• The percentage of current female smokers decreased from approximately 35% to 15%, which is more than twice. Since this option is not available in the second drop-down, we eliminate it.
• The percentage of former male smokers increased from approximately 20% to 25%, which is a 25% increase. Since this option is not available in the second drop-down, we eliminate it.
• The percentage of females who never smoked increased from approximately 100% - (35% + 8%) = 57% to 100% - (13% + 20%) = 67%, which is about a 20% increase. Since this option is not available in the second drop-down, we eliminate it.
• The percentage of males who never smoked increased from approximately 100% - (52% + 20%) = 28% to 100% - (18% + 25%) = 57%, which is approximately doubling. Since this option is available in the second drop-down, this is the correct answer.
Given that percentage of current female smokers decreased from approximately 35% to 15%, it a decrease by approximately 20% over the 50 year period, which is also one of the options. Why is this not a correct answer?
Bunuel
Official Solution:
Bunuel
The graph above illustrates trends in the prevalence of current and former cigarette smoking among adults aged 18 and older, categorized by gender.
According to the information in the chart, the most accurate statement regarding the adult smoker population from 1965 to 2015 is that the percentage of had over the fifty-year period.
Let's evaluate the change in the four categories given in the first drop-down.
• The percentage of current female smokers decreased from approximately 35% to 15%, which is more than twice. Since this option is not available in the second drop-down, we eliminate it.
• The percentage of former male smokers increased from approximately 20% to 25%, which is a 25% increase. Since this option is not available in the second drop-down, we eliminate it.
• The percentage of females who never smoked increased from approximately 100% - (35% + 8%) = 57% to 100% - (13% + 20%) = 67%, which is about a 20% increase. Since this option is not available in the second drop-down, we eliminate it.
• The percentage of males who never smoked increased from approximately 100% - (52% + 20%) = 28% to 100% - (18% + 25%) = 57%, which is approximately doubling. Since this option is available in the second drop-down, this is the correct answer.
Correct answer:
Dropdown 1: "males who never smoked"
Dropdown 2: "approximately doubled"
Show more
The drop from 35% to 15% is a 20 percentage point decrease, but in terms of percent change, it's about a 57% decrease:
(35 - 15)/35 ≈ 0.571.
So "decreased by 20%" is incorrect. It’s a 57% decrease, not 20%, which is why that option doesn’t fit.