Events & Promotions
|
|

GMAT Club Daily Prep
Thank you for using the timer - this advanced tool can estimate your performance and suggest more practice questions. We have subscribed you to Daily Prep Questions via email.
Customized
for You
Track
Your Progress
Practice
Pays
Not interested in getting valuable practice questions and articles delivered to your email? No problem, unsubscribe here.
 May 21
10:00 AM EDT
-11:59 PM EDT
Make the most of your break with the most realistic GMAT™ prep. Take up to $700 off select products. May 29
10:00 AM IST
-11:00 PM IST
Start your journey with a fully customized action plan and work with a dedicated mentor to achieve a 735+ score. Jun 10
06:00 AM PDT
-06:15 PM PDT
Register for the GMAT Club Virtual MBA Spotlight Fair – the world’s premier event for serious MBA candidates. This is your chance to hear directly from Admissions Directors at nearly every Top 30 MBA program..


Kudos
Bookmarks
Dropdown 1: Apparel
Dropdown 2: 2014
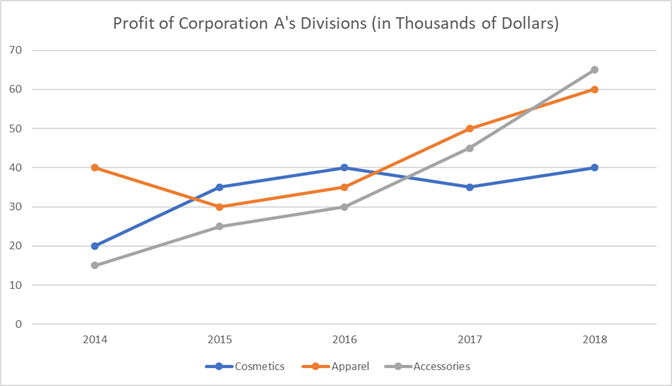
Corporation A consists of three distinct divisions: one focused on cosmetics, another on apparel, and the third on accessories. The line graph above illustrates the profit generated by these divisions over a five-year period, measured in thousands of dollars.
Select from each drop-down menu the option that creates the most accurate statement, given the information provided.
Based on the available information, the Division in had the largest share of total profit in any given year.
ShowHide Answer
Official Answer
Dropdown 1: Apparel
Dropdown 2: 2014
Kudos
Bookmarks
Official Solution:
We need to identify which division's profit accounted for the largest share of the total profit in a particular year.
• In 2014, the Apparel Division, with a profit of 40 thousand, accounted for more than 50% of the total profit of 75 thousand.
• In 2015, the Cosmetics Division, with a profit of 35 thousand, accounted for approximately 40% of the total profit of 90 thousand.
• In 2016, the Cosmetics Division, with a profit of 40 thousand, accounted for approximately 40% of the total profit of 105 thousand.
• In 2017, the Apparel Division, with a profit of 50 thousand, accounted for approximately 40% of the total profit of 130 thousand.
• In 2018, the Accessories Division, with a profit of 65 thousand, accounted for approximately 40% of the total profit of 165 thousand.
Therefore, the Apparel Division accounted for the largest share of the total profit in 2014.
Correct answer:
Dropdown 1: "Apparel"
Dropdown 2: "2014"
Bunuel
We need to identify which division's profit accounted for the largest share of the total profit in a particular year.
• In 2014, the Apparel Division, with a profit of 40 thousand, accounted for more than 50% of the total profit of 75 thousand.
• In 2015, the Cosmetics Division, with a profit of 35 thousand, accounted for approximately 40% of the total profit of 90 thousand.
• In 2016, the Cosmetics Division, with a profit of 40 thousand, accounted for approximately 40% of the total profit of 105 thousand.
• In 2017, the Apparel Division, with a profit of 50 thousand, accounted for approximately 40% of the total profit of 130 thousand.
• In 2018, the Accessories Division, with a profit of 65 thousand, accounted for approximately 40% of the total profit of 165 thousand.
Therefore, the Apparel Division accounted for the largest share of the total profit in 2014.
Correct answer:
Dropdown 1: "Apparel"
Dropdown 2: "2014"
Kudos
Bookmarks
I have revised the question, solution, and formatting by adding more details to enhance clarity.