Events & Promotions
|
|

GMAT Club Daily Prep
Thank you for using the timer - this advanced tool can estimate your performance and suggest more practice questions. We have subscribed you to Daily Prep Questions via email.
Customized
for You
Track
Your Progress
Practice
Pays
Not interested in getting valuable practice questions and articles delivered to your email? No problem, unsubscribe here.
 May 21
10:00 AM EDT
-11:59 PM EDT
Make the most of your break with the most realistic GMAT™ prep. Take up to $700 off select products. May 29
10:00 AM IST
-11:00 PM IST
Start your journey with a fully customized action plan and work with a dedicated mentor to achieve a 735+ score. Jun 10
06:00 AM PDT
-06:15 PM PDT
Register for the GMAT Club Virtual MBA Spotlight Fair – the world’s premier event for serious MBA candidates. This is your chance to hear directly from Admissions Directors at nearly every Top 30 MBA program..


Kudos
Bookmarks
Dropdown 1: 6
Dropdown 2: 12
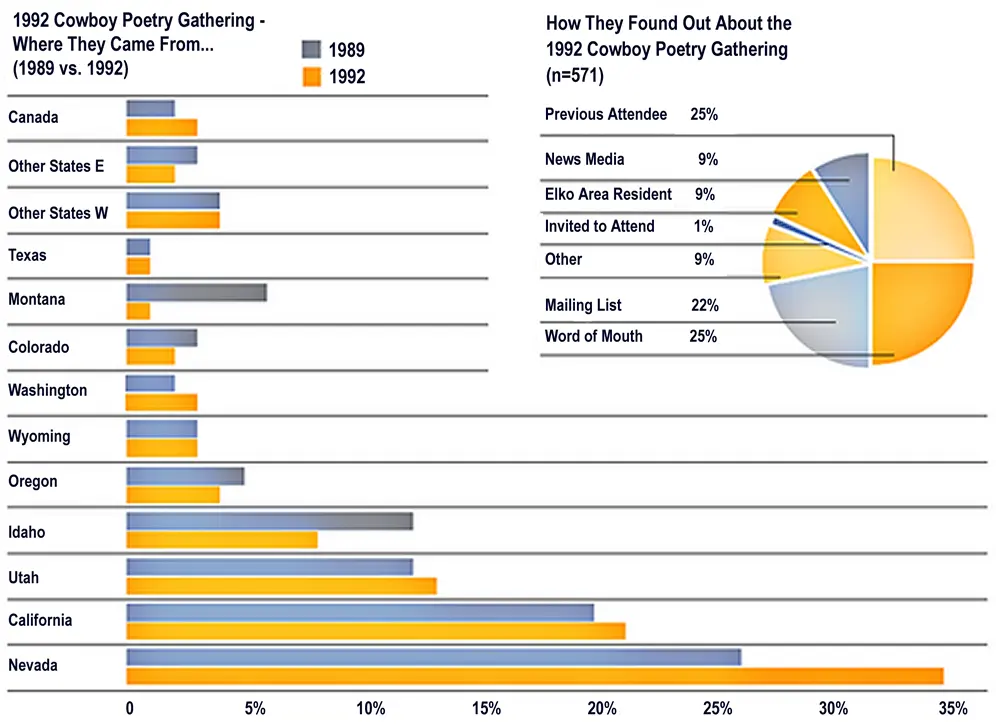
The bar graph shows the home regions of all attendees of the Cowboy Poetry Gathering, which was held twice: in 1989 and 1992, in Elko. The x-axis represents the percentage of total attendees from each region. The color combinations in the graph represent the attendees' home regions for both years. All attendees from the 1989 gathering also attended the 1992 gathering.
The pie chart shows how each of the 571 attendees (\(n\)) of the 1992 gathering learned about the event, with all of them providing responses to the survey.
Select from each drop-down menu the option that creates the most accurate statement, given the information provided.
The number of attendees who were invited to attend 1992 gathering was closest to .
If the number of attendees from Montana remained exactly the same in both the 1989 and 1992 gatherings, of the 13 given regions had more attendees in 1992 compared to 1989.
ShowHide Answer
Official Answer
Dropdown 1: 6
Dropdown 2: 12
Kudos
Bookmarks
Official Solution:
Drop-down 1:
From the pie chart, 1% of the 571 attendees were invited, which corresponds to approximately 6 people.
Drop-down 2:
From the pie chart, attendees from 1989 accounted for 25% of the 1992 attendees, indicating that the number of attendees in 1992 was four times that of 1989. For a region to have had more attendees in 1989 than in 1992, the bar for 1989 would need to be more than four times the bar for 1992. We are told that, for Montana, the number of attendees remained unchanged, meaning the bar for 1989 is exactly four times the bar for 1992. No other region has a bar that is more than four times larger in 1989 than in 1992, so 12 out of the 13 regions (excluding Montana) had more attendees in 1992 than in 1989.
Correct answer:
Dropdown 1: "6"
Dropdown 2: "12"
Bunuel
Drop-down 1:
From the pie chart, 1% of the 571 attendees were invited, which corresponds to approximately 6 people.
Drop-down 2:
From the pie chart, attendees from 1989 accounted for 25% of the 1992 attendees, indicating that the number of attendees in 1992 was four times that of 1989. For a region to have had more attendees in 1989 than in 1992, the bar for 1989 would need to be more than four times the bar for 1992. We are told that, for Montana, the number of attendees remained unchanged, meaning the bar for 1989 is exactly four times the bar for 1992. No other region has a bar that is more than four times larger in 1989 than in 1992, so 12 out of the 13 regions (excluding Montana) had more attendees in 1992 than in 1989.
Correct answer:
Dropdown 1: "6"
Dropdown 2: "12"

Kudos
Bookmarks
I think this is a high-quality question and I agree with explanation.