Events & Promotions
|
|

GMAT Club Daily Prep
Thank you for using the timer - this advanced tool can estimate your performance and suggest more practice questions. We have subscribed you to Daily Prep Questions via email.
Customized
for You
Track
Your Progress
Practice
Pays
Not interested in getting valuable practice questions and articles delivered to your email? No problem, unsubscribe here.
 May 21
10:00 AM EDT
-11:59 PM EDT
Make the most of your break with the most realistic GMAT™ prep. Take up to $700 off select products. May 28
08:30 AM PDT
-09:30 AM PDT
Are you constantly rereading GMAT RC passages but still struggling to understand them? Most students think rereading improves accuracy — but in reality, it usually signals a flawed reading strategy.- Jun 10
06:00 AM PDT
-06:15 PM PDT
Register for the GMAT Club Virtual MBA Spotlight Fair – the world’s premier event for serious MBA candidates. This is your chance to hear directly from Admissions Directors at nearly every Top 30 MBA program..


Kudos
Bookmarks
Dropdown 1: 2022 to 2023
Dropdown 2: 2024
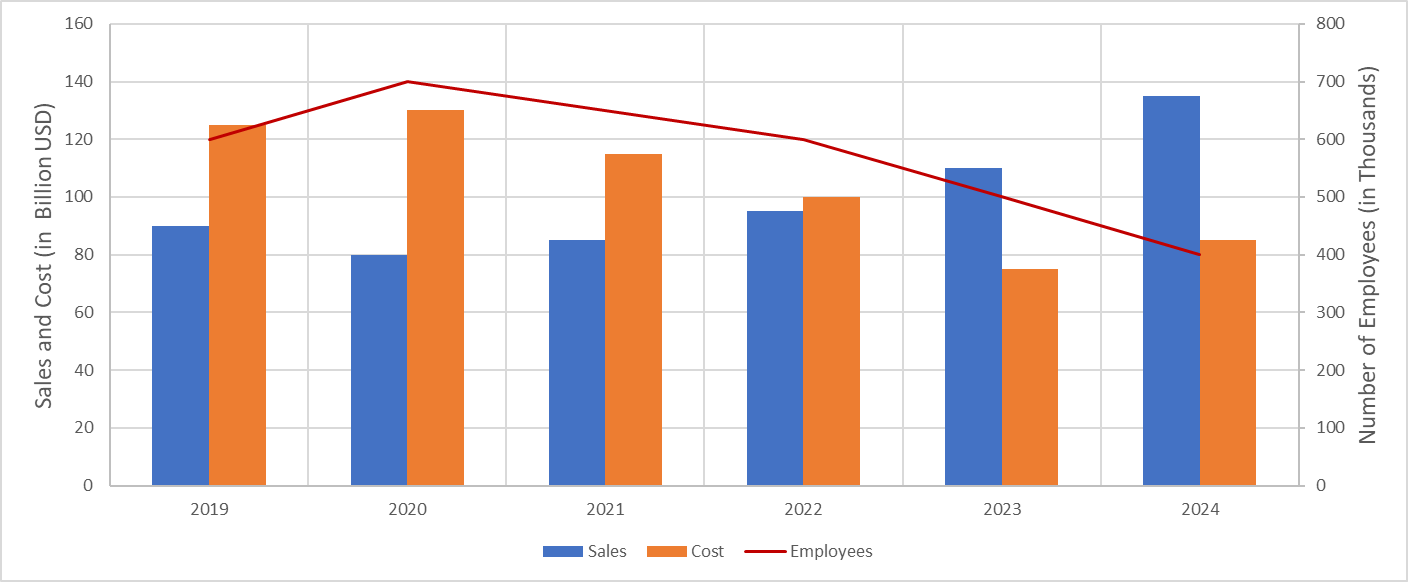
The chart shows a company’s performance from 2019 to 2024. Sales and cost (in billion USD) are plotted on the left vertical axis. The number of employees (in thousands) is plotted on the right vertical axis.
From each drop-down menu, select the option that creates the most accurate statement based on the information provided.
The cost incurred the greatest year-over-year percentage change from .
The company achieved its highest profit per employee in .
ShowHide Answer
Official Answer
Dropdown 1: 2022 to 2023
Dropdown 2: 2024
Kudos
Bookmarks
Official Solution:
Drop-down 1:
No need to calculate the change for each year. We are looking for the highest ratio of change to the previous year’s value. From the chart, the largest overall change in cost occurs from 2022 to 2023 — a sharp drop. The 2022 cost is also relatively low compared to other years, which makes the ratio of change to base (2022) even higher. Therefore, the greatest year-over-year percentage change occurred from 2022 to 2023.
Drop-down 2:
Similarly for this question, no calculations are needed. The highest profit (sales minus cost) occurred in 2024, and that year also had the lowest number of employees. A high profit combined with a low employee count makes the profit per employee ratio (profit/employees) highest in 2024.
Correct answer:
Dropdown 1: "2022 to 2023"
Dropdown 2: "2024"
Bunuel
Drop-down 1:
No need to calculate the change for each year. We are looking for the highest ratio of change to the previous year’s value. From the chart, the largest overall change in cost occurs from 2022 to 2023 — a sharp drop. The 2022 cost is also relatively low compared to other years, which makes the ratio of change to base (2022) even higher. Therefore, the greatest year-over-year percentage change occurred from 2022 to 2023.
Drop-down 2:
Similarly for this question, no calculations are needed. The highest profit (sales minus cost) occurred in 2024, and that year also had the lowest number of employees. A high profit combined with a low employee count makes the profit per employee ratio (profit/employees) highest in 2024.
Correct answer:
Dropdown 1: "2022 to 2023"
Dropdown 2: "2024"