Events & Promotions
|
|

GMAT Club Daily Prep
Thank you for using the timer - this advanced tool can estimate your performance and suggest more practice questions. We have subscribed you to Daily Prep Questions via email.
Customized
for You
Track
Your Progress
Practice
Pays
Not interested in getting valuable practice questions and articles delivered to your email? No problem, unsubscribe here.
 May 21
10:00 AM EDT
-11:59 PM EDT
Make the most of your break with the most realistic GMAT™ prep. Take up to $700 off select products. May 29
10:00 AM IST
-11:00 PM IST
Start your journey with a fully customized action plan and work with a dedicated mentor to achieve a 735+ score. Jun 10
06:00 AM PDT
-06:15 PM PDT
Register for the GMAT Club Virtual MBA Spotlight Fair – the world’s premier event for serious MBA candidates. This is your chance to hear directly from Admissions Directors at nearly every Top 30 MBA program..


Kudos
Bookmarks
Dropdown 1: Greenhouse A
Dropdown 2: Greenhouse B
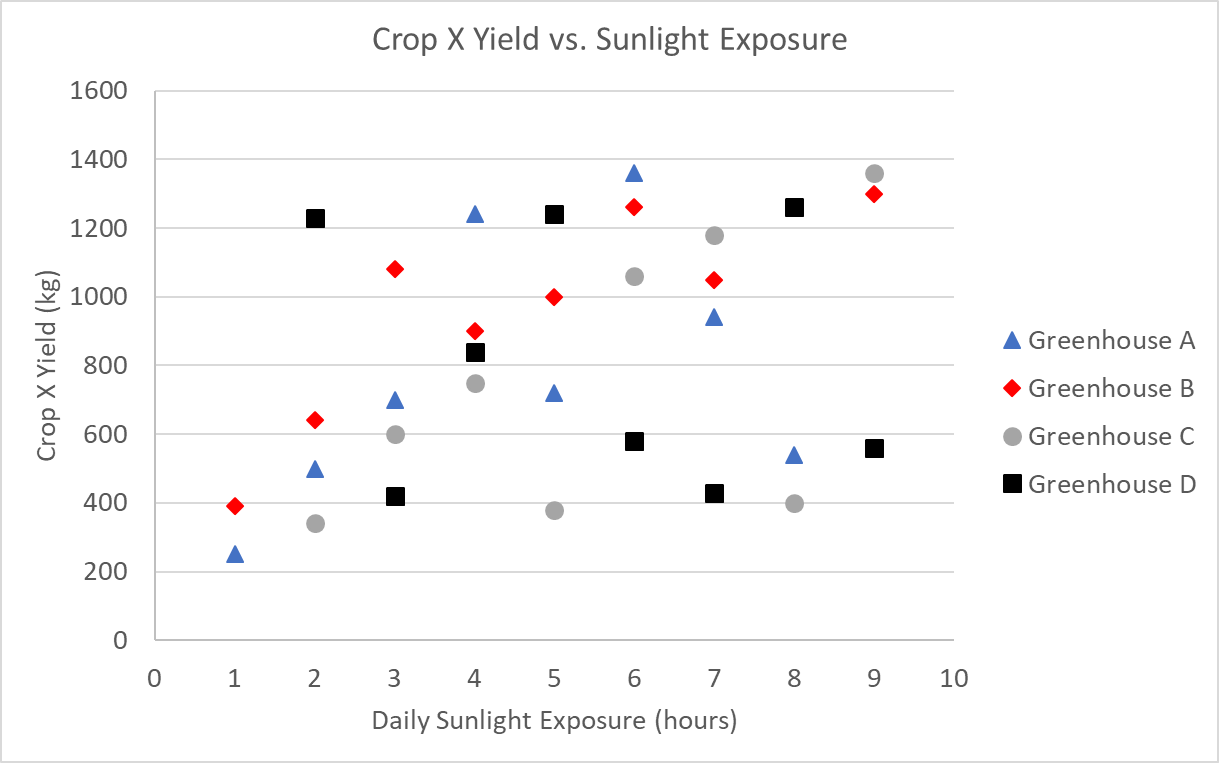
Four greenhouses each conducted eight controlled trials. For every trial, researchers recorded the daily sunlight exposure (in hours) and the corresponding yield of Crop X (in kilograms). The data are summarized in the graph.
Select from each drop-down menu the option that creates the most accurate statement based on the information provided.
The greenhouse with the greatest range of recorded yields was .
The greenhouse with the greatest median recorded yield was .
ShowHide Answer
Official Answer
Dropdown 1: Greenhouse A
Dropdown 2: Greenhouse B
Kudos
Bookmarks
Official Solution:
Drop-down 1:
The range is defined as the difference between the highest and lowest values. By scanning the graph, we can see that Greenhouse A’s points span from about 250 up to about 1350, which is a larger gap than the others.
Answer: Greenhouse A
Drop-down 2:
The median is the middle value when ordered, or for 8 values, the average of the 4th and 5th largest.
• Greenhouse A: 4th and 5th yields are both around 700, so the median is about 700
• Greenhouse B: 4th is about 1000 and 5th a bit above 1000, so the median is slightly above 1000
• Greenhouse C: 4th is about 600 and 5th a bit below 800, so the median is slightly below 700
• Greenhouse D: 4th is just below 600 and 5th just above 800, so the median is about 700
Thus, the greatest median belongs to Greenhouse B.
Answer: Greenhouse B
Correct answer:
Dropdown 1: "Greenhouse A"
Dropdown 2: "Greenhouse B"
bb
Drop-down 1:
The range is defined as the difference between the highest and lowest values. By scanning the graph, we can see that Greenhouse A’s points span from about 250 up to about 1350, which is a larger gap than the others.
Answer: Greenhouse A
Drop-down 2:
The median is the middle value when ordered, or for 8 values, the average of the 4th and 5th largest.
• Greenhouse A: 4th and 5th yields are both around 700, so the median is about 700
• Greenhouse B: 4th is about 1000 and 5th a bit above 1000, so the median is slightly above 1000
• Greenhouse C: 4th is about 600 and 5th a bit below 800, so the median is slightly below 700
• Greenhouse D: 4th is just below 600 and 5th just above 800, so the median is about 700
Thus, the greatest median belongs to Greenhouse B.
Answer: Greenhouse B
Correct answer:
Dropdown 1: "Greenhouse A"
Dropdown 2: "Greenhouse B"


