Events & Promotions
|
|

GMAT Club Daily Prep
Thank you for using the timer - this advanced tool can estimate your performance and suggest more practice questions. We have subscribed you to Daily Prep Questions via email.
Customized
for You
Track
Your Progress
Practice
Pays
Not interested in getting valuable practice questions and articles delivered to your email? No problem, unsubscribe here.
 May 21
10:00 AM EDT
-11:59 PM EDT
Make the most of your break with the most realistic GMAT™ prep. Take up to $700 off select products. May 29
10:00 AM IST
-11:00 PM IST
Start your journey with a fully customized action plan and work with a dedicated mentor to achieve a 735+ score. Jun 10
06:00 AM PDT
-06:15 PM PDT
Register for the GMAT Club Virtual MBA Spotlight Fair – the world’s premier event for serious MBA candidates. This is your chance to hear directly from Admissions Directors at nearly every Top 30 MBA program..


Kudos
Bookmarks
Dropdown 1: 20th
Dropdown 2: more than 150%
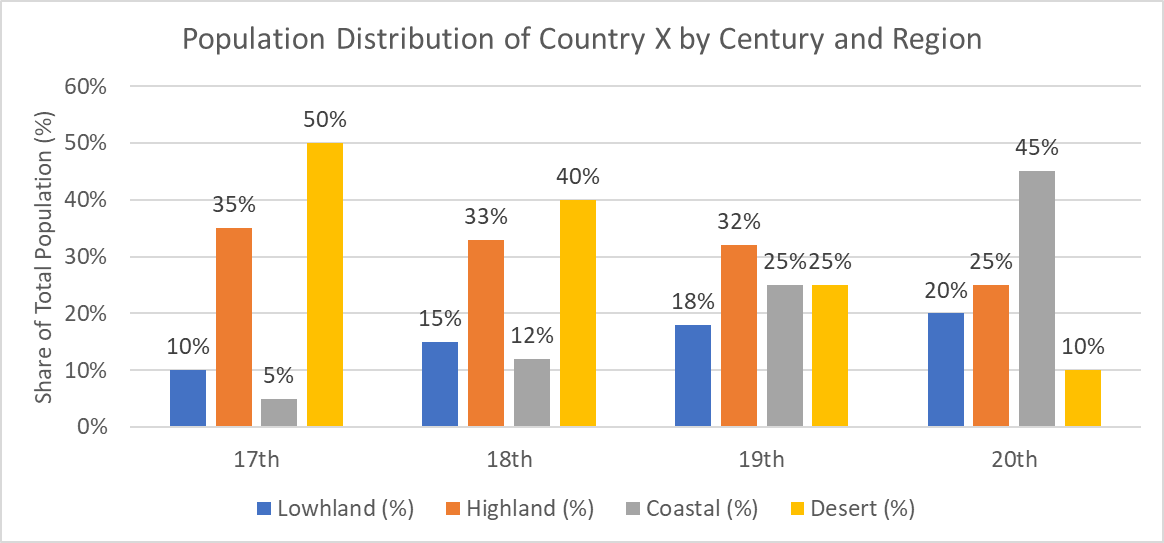
The chart shows the percentage of the total population of Country X, measured at the end of each century, living in each of its four regions (Lowland, Highland, Coastal, and Desert). In each century, the population of every region increased compared with the prior century.
From each drop-down menu, select the option that creates the most accurate statement based on the information given.
The largest percentage increase in the total population from one century to the next occurred in the Century, when the total population increased by .
ShowHide Answer
Official Answer
Dropdown 1: 20th
Dropdown 2: more than 150%
Kudos
Bookmarks
Official Solution:
To determine the increase in total population from one century to the next, focus on the region whose share decreased the most. Since every region’s population increased, a decline in share means that the total must have risen enough to offset this growth.
• 17th to 18th Century: Desert fell from 50% to 40%. Suppose the total population in the 17th Century was 100, so Desert had 50 people. In the 18th Century, Desert’s population was more than 50, which represented 40% of the new total. For 40% to exceed 50, the new total must have been more than 125, implying an increase of more than 25%.
• 18th to 19th Century: Desert fell from 40% to 25%. If the 18th-Century total was 100, then Desert had 40 people. In the 19th Century, 25% had to exceed 40, so the new total had to be more than 160, which means an increase of more than 60%.
• 19th to 20th Century: Desert fell from 25% to 10%. If the 19th-Century total was 100, then Desert had 25 people. In the 20th Century, 10% had to exceed 25, so the new total had to be more than 250. This means the population increased by more than 2.5 times, which corresponds to an increase of more than 150%.
Thus, the largest increase occurred in the 20th Century, when the total population rose by more than 150% compared with the 19th Century.
Correct answer:
Dropdown 1: "20th"
Dropdown 2: "more than 150%"
Bunuel
To determine the increase in total population from one century to the next, focus on the region whose share decreased the most. Since every region’s population increased, a decline in share means that the total must have risen enough to offset this growth.
• 17th to 18th Century: Desert fell from 50% to 40%. Suppose the total population in the 17th Century was 100, so Desert had 50 people. In the 18th Century, Desert’s population was more than 50, which represented 40% of the new total. For 40% to exceed 50, the new total must have been more than 125, implying an increase of more than 25%.
• 18th to 19th Century: Desert fell from 40% to 25%. If the 18th-Century total was 100, then Desert had 40 people. In the 19th Century, 25% had to exceed 40, so the new total had to be more than 160, which means an increase of more than 60%.
• 19th to 20th Century: Desert fell from 25% to 10%. If the 19th-Century total was 100, then Desert had 25 people. In the 20th Century, 10% had to exceed 25, so the new total had to be more than 250. This means the population increased by more than 2.5 times, which corresponds to an increase of more than 150%.
Thus, the largest increase occurred in the 20th Century, when the total population rose by more than 150% compared with the 19th Century.
Correct answer:
Dropdown 1: "20th"
Dropdown 2: "more than 150%"

Kudos
Bookmarks
I like the solution - it’s helpful.


