Events & Promotions
|
|

GMAT Club Daily Prep
Thank you for using the timer - this advanced tool can estimate your performance and suggest more practice questions. We have subscribed you to Daily Prep Questions via email.
Customized
for You
Track
Your Progress
Practice
Pays
Not interested in getting valuable practice questions and articles delivered to your email? No problem, unsubscribe here.
 May 21
10:00 AM EDT
-11:59 PM EDT
Make the most of your break with the most realistic GMAT™ prep. Take up to $700 off select products. May 29
10:00 AM IST
-11:00 PM IST
Start your journey with a fully customized action plan and work with a dedicated mentor to achieve a 735+ score. Jun 10
06:00 AM PDT
-06:15 PM PDT
Register for the GMAT Club Virtual MBA Spotlight Fair – the world’s premier event for serious MBA candidates. This is your chance to hear directly from Admissions Directors at nearly every Top 30 MBA program..


Kudos
Bookmarks
Dropdown 1: 140 minutes
Dropdown 2: twice as much as
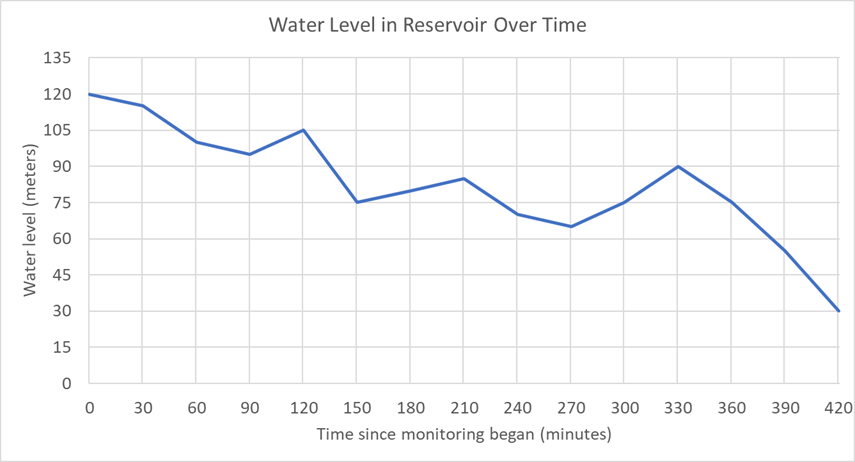
The chart shows the water level in a reservoir over time. The vertical axis represents the water level, in meters, relative to the bottom of the reservoir. The horizontal axis represents the time, in minutes, since monitoring began.
The water level generally decreases as water is used for irrigation, but occasional rainfall causes the level to rise temporarily.
Select the option from each drop-down menu that creates the statement that most accurately reflects the information provided.
If the average rate of water level decrease monitored over the seven hours continues, the water level would reach zero after minutes.
The largest decrease in water level during any 30-minute interval shown on the graph was the largest increase during any 30-minute interval.
ShowHide Answer
Official Answer
Dropdown 1: 140 minutes
Dropdown 2: twice as much as
Kudos
Bookmarks
Official Solution:
Drop-down 1:
Over 420 minutes, the water level dropped from 120 meters to 30 meters, a total decrease of 90 meters. At the same rate, the remaining 30 meters, which is one-third of 90, would take one-third of the time, so 420/3 = 140 minutes.
Drop-down 2:
From the graph, the steepest 30-minute decrease occurred between 120 and 150 minutes, when the level fell from 105 meters to 75 meters (a 30-meter drop). The steepest 30-minute increase occurred between 300 and 330 minutes, when the level rose from 75 meters to 90 meters (a 15-meter rise). The largest decrease (30 meters) is exactly twice as much as the largest increase (15 meters).
Correct answer:
Dropdown 1: "140 minutes"
Dropdown 2: "twice as much as"
bb
Drop-down 1:
Over 420 minutes, the water level dropped from 120 meters to 30 meters, a total decrease of 90 meters. At the same rate, the remaining 30 meters, which is one-third of 90, would take one-third of the time, so 420/3 = 140 minutes.
Drop-down 2:
From the graph, the steepest 30-minute decrease occurred between 120 and 150 minutes, when the level fell from 105 meters to 75 meters (a 30-meter drop). The steepest 30-minute increase occurred between 300 and 330 minutes, when the level rose from 75 meters to 90 meters (a 15-meter rise). The largest decrease (30 meters) is exactly twice as much as the largest increase (15 meters).
Correct answer:
Dropdown 1: "140 minutes"
Dropdown 2: "twice as much as"


