Events & Promotions
|
|

GMAT Club Daily Prep
Thank you for using the timer - this advanced tool can estimate your performance and suggest more practice questions. We have subscribed you to Daily Prep Questions via email.
Customized
for You
Track
Your Progress
Practice
Pays
Not interested in getting valuable practice questions and articles delivered to your email? No problem, unsubscribe here.
 May 21
10:00 AM EDT
-11:59 PM EDT
Make the most of your break with the most realistic GMAT™ prep. Take up to $700 off select products. May 29
10:00 AM IST
-11:00 PM IST
Start your journey with a fully customized action plan and work with a dedicated mentor to achieve a 735+ score. Jun 10
06:00 AM PDT
-06:15 PM PDT
Register for the GMAT Club Virtual MBA Spotlight Fair – the world’s premier event for serious MBA candidates. This is your chance to hear directly from Admissions Directors at nearly every Top 30 MBA program..


Kudos
Bookmarks
Dropdown 1: Company C
Dropdown 2: +$10
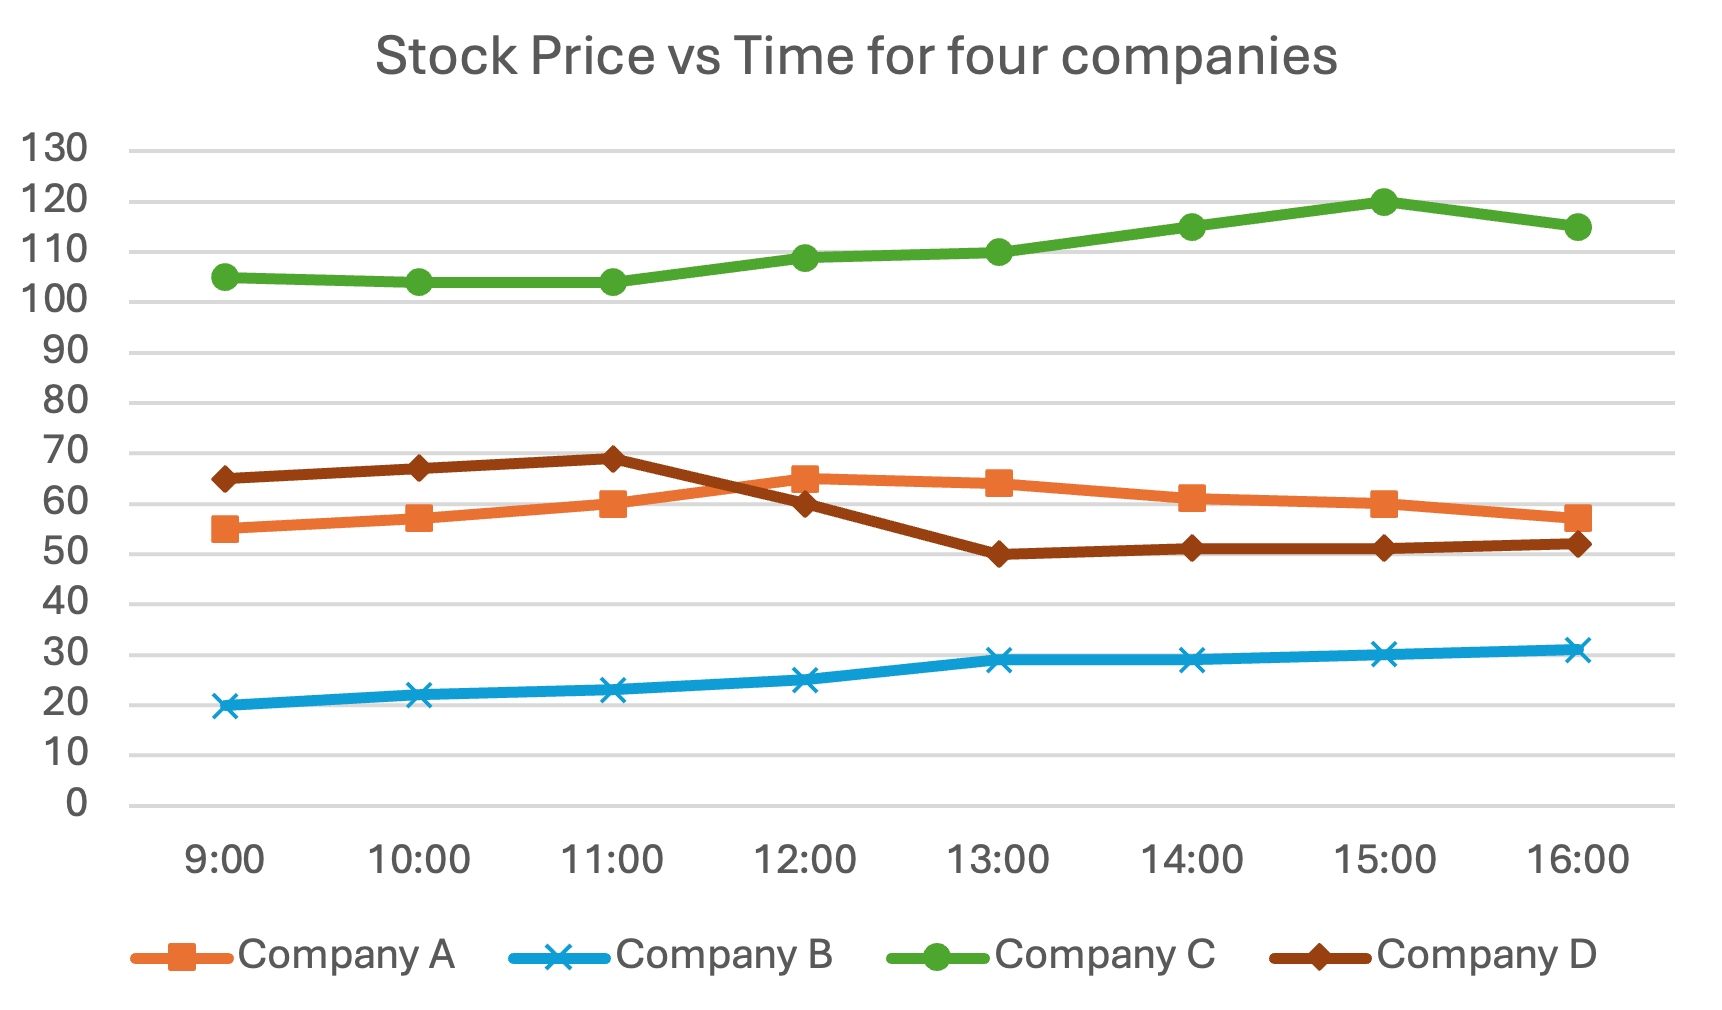
A day trader bought 50 shares of one of the companies shown in the graph, at the stock prices (in dollars) indicated in the graph above. He purchased the shares at 9:00, when the market opened, and sold all 50 shares at 13:00.
Select from each drop-down menu the option that creates the most accurate statement, given the information provided.
If the trader made a total profit of $250 on that day, he bought shares of , which at the market close at 16:00 had an overall price change of approximately .
ShowHide Answer
Official Answer
Dropdown 1: Company C
Dropdown 2: +$10
Kudos
Bookmarks
Official Solution:
Drop-down 1:
We are told that the day trader made a total profit of $250 from trading 50 shares of a particular company.
Since profit = (selling price – buying price) × number of shares, the stock price must have increased by $250 ÷ 50 = $5 between 9:00 and 13:00.
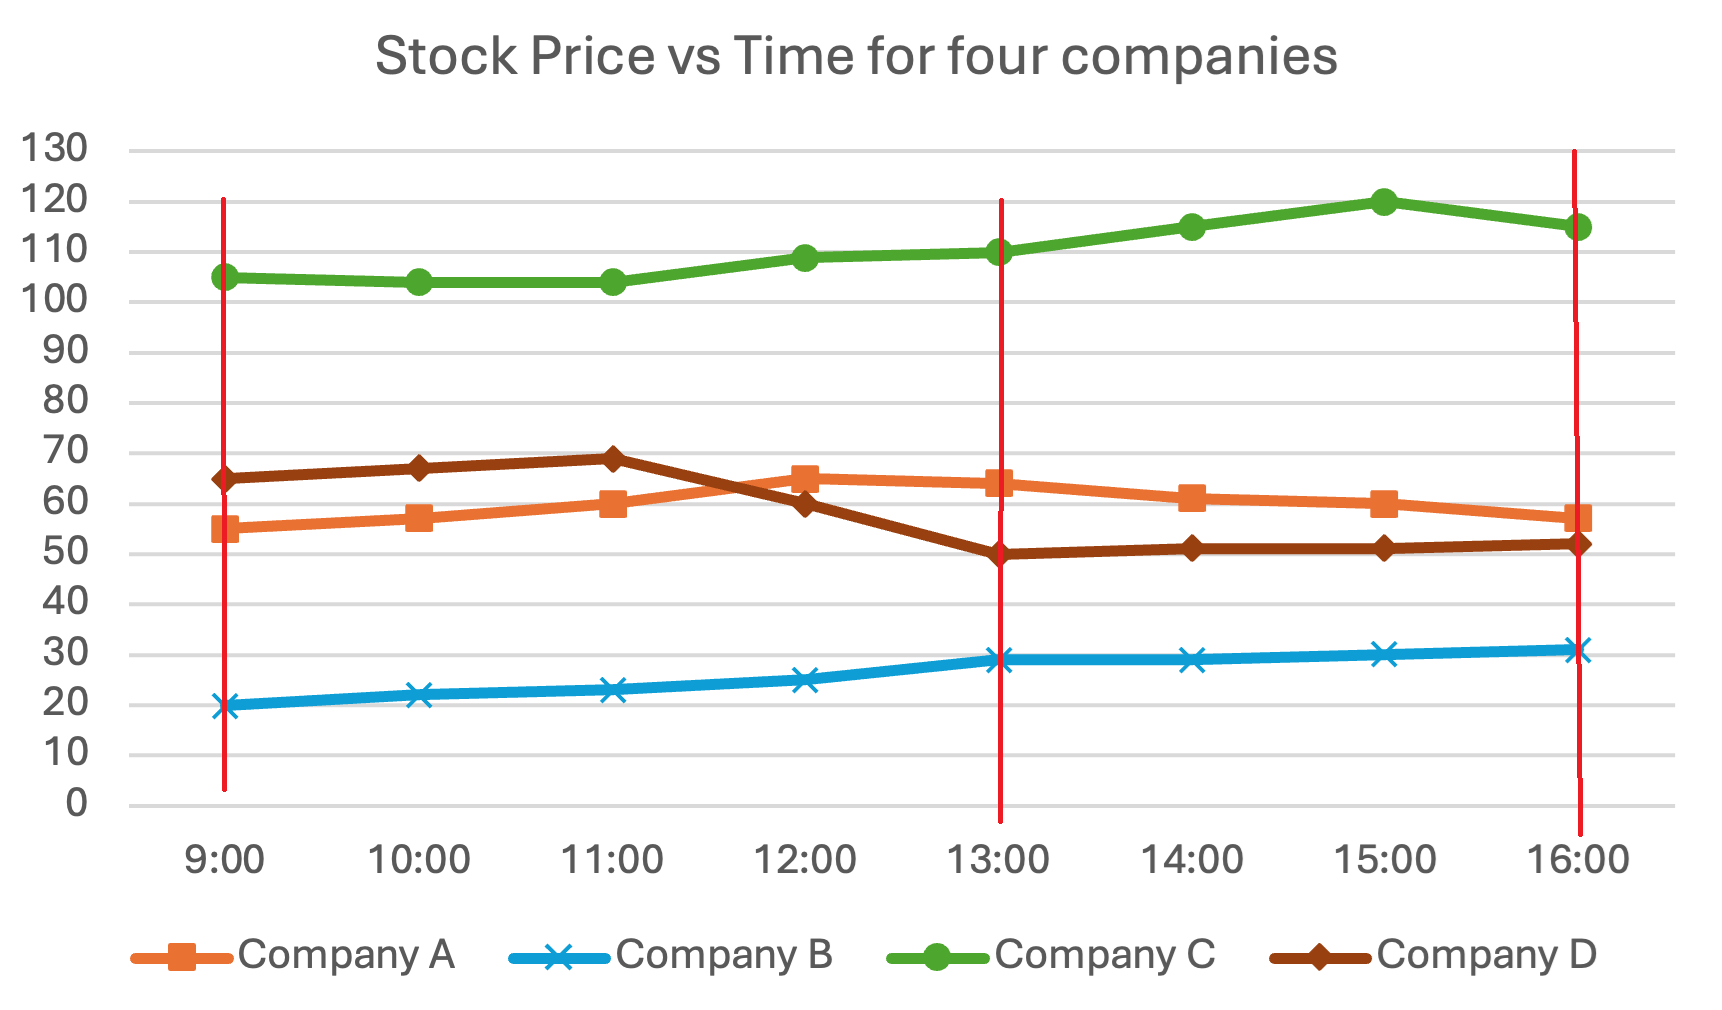
We need to identify the company whose stock price increased by $5 during that time period. Note that the graph shows stock prices beyond 13:00, but only the price change from 9:00 to 13:00 is relevant to the trader’s profit.
From 9:00 to 13:00, the following price changes occurred. We should check all companies to be certain. No calculator is needed — we can quickly note the differences and identify which company had a price increase of $5.
Company A: 55 → 65, a change of +10
Company B: 20 → 30, a change of +10
Company C: 105 → 110, a change of +5 — Correct
Company D: 65 → 50, a change of –15
Drop-down 2:
At the market close at 16:00, Company C had an overall price change of +$10, from $105 to $115.
Correct answer:
Dropdown 1: "Company C"
Dropdown 2: "+$10"
Bunuel
Drop-down 1:
We are told that the day trader made a total profit of $250 from trading 50 shares of a particular company.
Since profit = (selling price – buying price) × number of shares, the stock price must have increased by $250 ÷ 50 = $5 between 9:00 and 13:00.
We need to identify the company whose stock price increased by $5 during that time period. Note that the graph shows stock prices beyond 13:00, but only the price change from 9:00 to 13:00 is relevant to the trader’s profit.
From 9:00 to 13:00, the following price changes occurred. We should check all companies to be certain. No calculator is needed — we can quickly note the differences and identify which company had a price increase of $5.
Company A: 55 → 65, a change of +10
Company B: 20 → 30, a change of +10
Company C: 105 → 110, a change of +5 — Correct
Company D: 65 → 50, a change of –15
Drop-down 2:
At the market close at 16:00, Company C had an overall price change of +$10, from $105 to $115.
Correct answer:
Dropdown 1: "Company C"
Dropdown 2: "+$10"


