Events & Promotions
|
|

GMAT Club Daily Prep
Thank you for using the timer - this advanced tool can estimate your performance and suggest more practice questions. We have subscribed you to Daily Prep Questions via email.
Customized
for You
Track
Your Progress
Practice
Pays
Not interested in getting valuable practice questions and articles delivered to your email? No problem, unsubscribe here.
 May 21
10:00 AM EDT
-11:59 PM EDT
Make the most of your break with the most realistic GMAT™ prep. Take up to $700 off select products. May 28
08:30 AM PDT
-09:30 AM PDT
Are you constantly rereading GMAT RC passages but still struggling to understand them? Most students think rereading improves accuracy — but in reality, it usually signals a flawed reading strategy.- Jun 10
06:00 AM PDT
-06:15 PM PDT
Register for the GMAT Club Virtual MBA Spotlight Fair – the world’s premier event for serious MBA candidates. This is your chance to hear directly from Admissions Directors at nearly every Top 30 MBA program..


Kudos
Bookmarks
Dropdown 1: Campaign A
Dropdown 2: 5.5
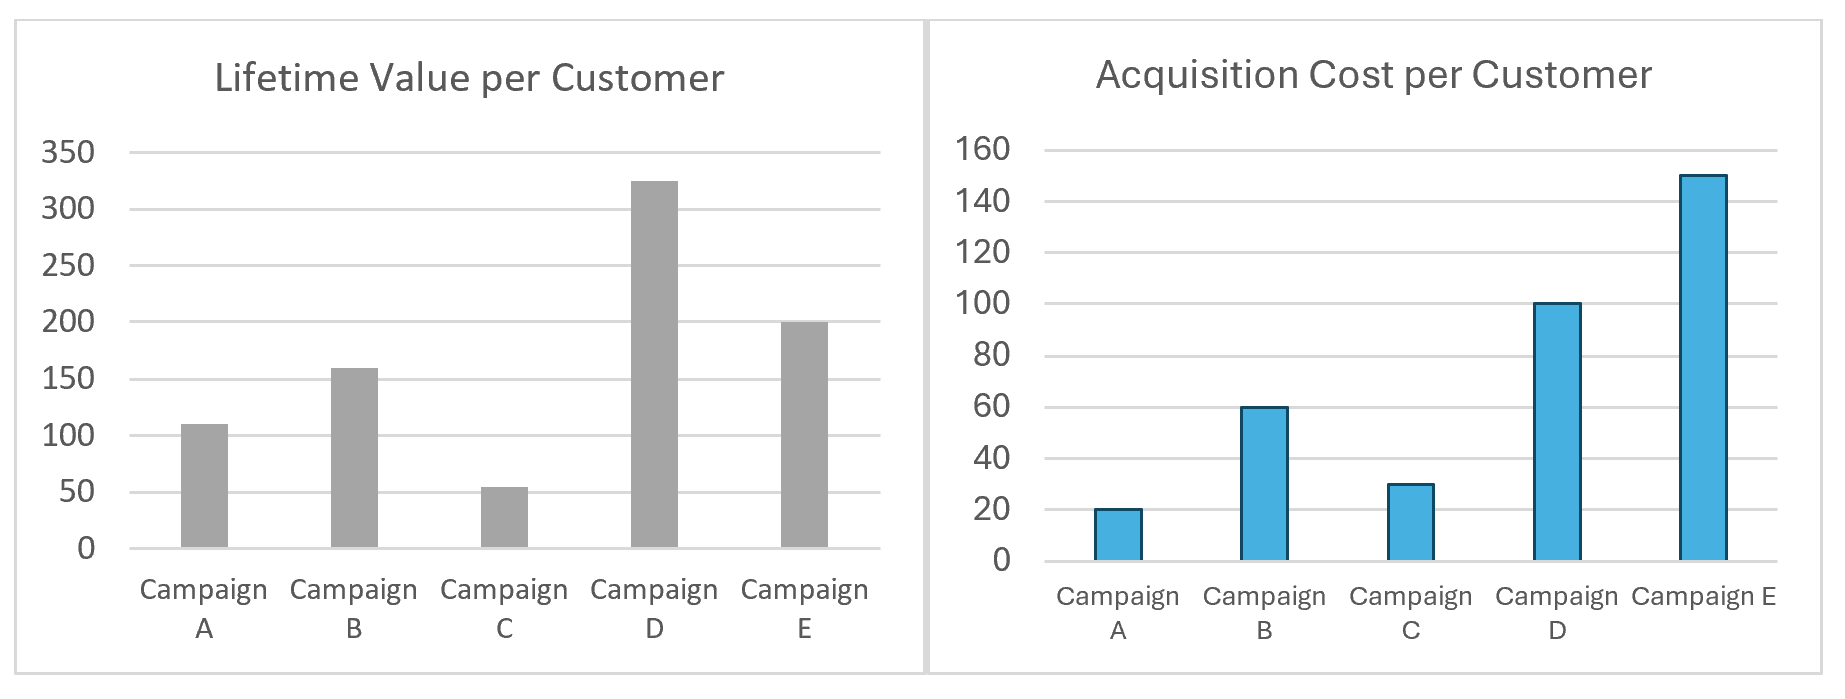
The two bar graphs show the results of five test advertising campaigns conducted by a marketing agency. The first graph displays the estimated Lifetime Value per customer (total revenue expected from a customer, in USD), and the second graph displays the Acquisition Cost per customer (cost to acquire one customer, in USD).
From each drop-down menu, select the option that creates the most accurate statement based on the information provided.
If each campaign acquired the same number of customers, the campaign with the highest ratio of Total Lifetime Value to Total Acquisition Cost is , with an approximate value of .
ShowHide Answer
Official Answer
Dropdown 1: Campaign A
Dropdown 2: 5.5
Kudos
Bookmarks
Official Solution:
Since each campaign acquired the same number of customers, the ratio of total Lifetime Value to total Acquisition Cost will be the same as the ratio per customer. So, we can compare the per-customer values directly to find the highest overall ratio.
Campaign A:
Lifetime Value ≈ 110 USD, Acquisition Cost ≈ 20 USD
Ratio = 110 / 20 = 5.5
Campaign B:
Lifetime Value ≈ 160 USD, Acquisition Cost ≈ 60 USD
Ratio = 160 / 60 ≈ 2.7
Campaign C:
Lifetime Value ≈ 50 USD, Acquisition Cost ≈ 30 USD
Ratio = 50 / 30 ≈ 1.7
Campaign D:
Lifetime Value ≈ 325 USD, Acquisition Cost ≈ 100 USD
Ratio = 325 / 100 ≈ 3.3
Campaign E:
Lifetime Value ≈ 200 USD, Acquisition Cost ≈ 150 USD
Ratio = 200 / 150 ≈ 1.3
The campaign with the highest ratio is Campaign A, with an approximate value of 5.5.
Correct answer:
Dropdown 1: "Campaign A"
Dropdown 2: "5.5"
Bunuel
Since each campaign acquired the same number of customers, the ratio of total Lifetime Value to total Acquisition Cost will be the same as the ratio per customer. So, we can compare the per-customer values directly to find the highest overall ratio.
Campaign A:
Lifetime Value ≈ 110 USD, Acquisition Cost ≈ 20 USD
Ratio = 110 / 20 = 5.5
Campaign B:
Lifetime Value ≈ 160 USD, Acquisition Cost ≈ 60 USD
Ratio = 160 / 60 ≈ 2.7
Campaign C:
Lifetime Value ≈ 50 USD, Acquisition Cost ≈ 30 USD
Ratio = 50 / 30 ≈ 1.7
Campaign D:
Lifetime Value ≈ 325 USD, Acquisition Cost ≈ 100 USD
Ratio = 325 / 100 ≈ 3.3
Campaign E:
Lifetime Value ≈ 200 USD, Acquisition Cost ≈ 150 USD
Ratio = 200 / 150 ≈ 1.3
The campaign with the highest ratio is Campaign A, with an approximate value of 5.5.
Correct answer:
Dropdown 1: "Campaign A"
Dropdown 2: "5.5"