Events & Promotions
|
|

GMAT Club Daily Prep
Thank you for using the timer - this advanced tool can estimate your performance and suggest more practice questions. We have subscribed you to Daily Prep Questions via email.
Customized
for You
Track
Your Progress
Practice
Pays
Not interested in getting valuable practice questions and articles delivered to your email? No problem, unsubscribe here.
 May 21
10:00 AM EDT
-11:59 PM EDT
Make the most of your break with the most realistic GMAT™ prep. Take up to $700 off select products. May 29
10:00 AM IST
-11:00 PM IST
Start your journey with a fully customized action plan and work with a dedicated mentor to achieve a 735+ score. Jun 10
06:00 AM PDT
-06:15 PM PDT
Register for the GMAT Club Virtual MBA Spotlight Fair – the world’s premier event for serious MBA candidates. This is your chance to hear directly from Admissions Directors at nearly every Top 30 MBA program..


Kudos
Bookmarks
According to the psychological phenomenon of attachment to sunk costs as well as the more general principle of psychological commitment and consistency, people’s self-image and emotions become more and more invested in achieving a goal as total expenditures in pursuit of that goal increase. Therefore, as total project expenditures increase, clients will become more and more strongly biased toward reporting complete satisfaction with the consultants’ work and the project outcomes.: Consistent
The more consultants who work in a given office, the broader the range of their individual specialties and areas of expertise—and thus the greater the likelihood that each of the office’s projects will be staffed with consultants with the necessary competence and background to perform the work to the complete satisfaction of the client.: Consistent
For some of the company’s projects, the client’s goals include intangible objectives, such as development of the client’s cross-cultural insight and leadership skills, in addition to revenue generation. Although these projects typically generate less revenue than those strictly focused on cash flow and profitability gains, they almost invariably receive perfect client satisfaction ratings.: Consistent
A consulting firm tracks performance metrics for eight regional offices, four in each of two geographic regions (East and West). The following table contains these metrics for calendar year 2019. This firm hires consultants for its regional offices on a calendar-year basis, so the number of consultants employed at each office listed did not change at any point during 2019.
Each of the following statements, if true, predicts the existence of a correlation between two of the metrics in the table. For each statement, select Consistent if the predicted correlation holds for the data in the table. Otherwise, select Inconsistent.
2019 Regional Office Performance Data
| Office | Region | Consultants | Projects Completed | Avg Project Revenue (\(k) | Total Costs (\)M) | Client Satisfaction (%) |
|---|---|---|---|---|---|---|
| A | West | 42 | 115 | 86 | 7.9 | 91 |
| B | East | 35 | 104 | 93 | 7.4 | 88 |
| C | West | 51 | 135 | 79 | 9.8 | 94 |
| D | East | 28 | 96 | 102 | 7.1 | 85 |
| E | East | 47 | 122 | 89 | 8.6 | 92 |
| F | East | 39 | 110 | 90 | 8.1 | 90 |
| G | West | 33 | 89 | 95 | 6.2 | 87 |
| H | West | 44 | 120 | 84 | 8.5 | 93 |
Each of the following statements, if true, predicts the existence of a correlation between two of the metrics in the table. For each statement, select Consistent if the predicted correlation holds for the data in the table. Otherwise, select Inconsistent.
| Consistent | Inconsistent | |
| According to the psychological phenomenon of attachment to sunk costs as well as the more general principle of psychological commitment and consistency, people’s self-image and emotions become more and more invested in achieving a goal as total expenditures in pursuit of that goal increase. Therefore, as total project expenditures increase, clients will become more and more strongly biased toward reporting complete satisfaction with the consultants’ work and the project outcomes. | ||
| The more consultants who work in a given office, the broader the range of their individual specialties and areas of expertise—and thus the greater the likelihood that each of the office’s projects will be staffed with consultants with the necessary competence and background to perform the work to the complete satisfaction of the client. | ||
| For some of the company’s projects, the client’s goals include intangible objectives, such as development of the client’s cross-cultural insight and leadership skills, in addition to revenue generation. Although these projects typically generate less revenue than those strictly focused on cash flow and profitability gains, they almost invariably receive perfect client satisfaction ratings. |
ShowHide Answer
Official Answer
According to the psychological phenomenon of attachment to sunk costs as well as the more general principle of psychological commitment and consistency, people’s self-image and emotions become more and more invested in achieving a goal as total expenditures in pursuit of that goal increase. Therefore, as total project expenditures increase, clients will become more and more strongly biased toward reporting complete satisfaction with the consultants’ work and the project outcomes.: Consistent
The more consultants who work in a given office, the broader the range of their individual specialties and areas of expertise—and thus the greater the likelihood that each of the office’s projects will be staffed with consultants with the necessary competence and background to perform the work to the complete satisfaction of the client.: Consistent
For some of the company’s projects, the client’s goals include intangible objectives, such as development of the client’s cross-cultural insight and leadership skills, in addition to revenue generation. Although these projects typically generate less revenue than those strictly focused on cash flow and profitability gains, they almost invariably receive perfect client satisfaction ratings.: Consistent
Kudos
Bookmarks
Official Solution:
Part I: “According to the psychological phenomenon of attachment to sunk costs as well as the more general principle of psychological commitment and consistency, people’s self-image and emotions become more and more invested in achieving a goal as total expenditures in pursuit of that goal increase. Therefore, as total project expenditures increase, clients will become more and more strongly biased toward reporting complete satisfaction with the consultants’ work and the project outcomes.”
In this statement there’s no possible confusion about the correlation being asserted: “as total project expenditures increase, clients will become more and more strongly biased toward reporting complete satisfaction.” So, we need to look for a positive correlation between Total Costs and Client Satisfaction Rate.
We can sort by either one of these two variables (for the same reason why it doesn’t matter which variable goes on the x-axis of a scatterplot, if we’re looking only for correlation). If we sort by Total Costs, the two columns of interest are as follows:
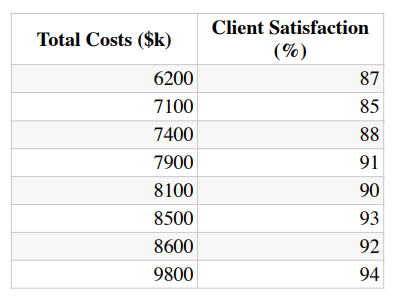
The positive correlation is obvious. (Note how all the percentages in the 80s come first, followed by all the ones in the 90s.) So this statement is Consistent with the table.
Part II: “The more consultants who work in a given office, the broader the range of their individual specialties and areas of expertise—and thus the greater the likelihood that each of the office’s projects will be staffed with consultants with the necessary competence and background to perform the work to the complete satisfaction of the client.”
The correlation ultimately being predicted here is between Number of Consultants (“the more consultants who work in a given office...”) and Client Satisfaction Rating (“...to the complete satisfaction of the client”). Sort by either of these and then check for the necessary (positive) correlation.
If we sort by Number of Consultants, the results are as follows:
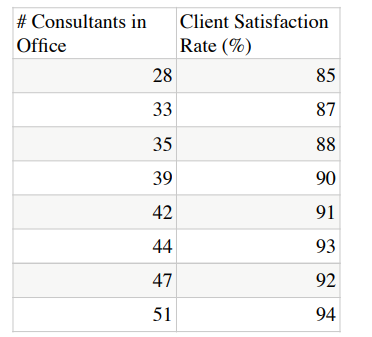
Once again, the positive correlation is obvious. (Were it not for the 93% and 92% values coming out of order, the correlation here would be perfect.) This statement is also Consistent with the table.
Part III: “For some of the company’s projects, the client’s goals include intangible objectives, such as development of the client’s cross-cultural insight and leadership skills, in addition to revenue generation. Although these projects typically generate less revenue than those strictly focused on cash flow and profitability gains, they almost invariably receive perfect client satisfaction ratings.”
We have no information whatsoever about project goals, so the relevant correlation is between the other two metrics mentioned here: Average Project Revenue (“these projects typically generate less revenue”) and “client satisfaction ratings”. So, we need to sort the rows by one of these variables (once again it doesn’t particularly matter which one), and then check to see whether the resulting columns are ANTI-correlated (as one goes up, the other goes down).
Here’s what we get from sorting by Average Project Revenue:
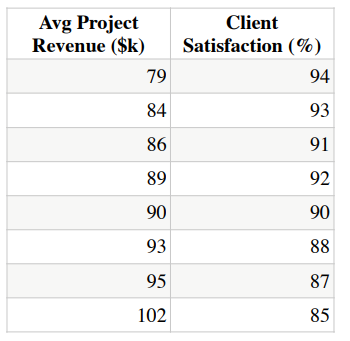
Just like last time, the desired correlation is as close as possible to perfect without actually being perfect (marred only by the 92% and 91% figures coming out of order). So this statement, too, is very much Consistent with the table.
Correct answer:
According to the psychological phenomenon of attachment to sunk costs as well as the more general principle of psychological commitment and consistency, people’s self-image and emotions become more and more invested in achieving a goal as total expenditures in pursuit of that goal increase. Therefore, as total project expenditures increase, clients will become more and more strongly biased toward reporting complete satisfaction with the consultants’ work and the project outcomes. "Consistent"
The more consultants who work in a given office, the broader the range of their individual specialties and areas of expertise—and thus the greater the likelihood that each of the office’s projects will be staffed with consultants with the necessary competence and background to perform the work to the complete satisfaction of the client. "Consistent"
For some of the company’s projects, the client’s goals include intangible objectives, such as development of the client’s cross-cultural insight and leadership skills, in addition to revenue generation. Although these projects typically generate less revenue than those strictly focused on cash flow and profitability gains, they almost invariably receive perfect client satisfaction ratings. "Consistent"
Bunuel
Part I: “According to the psychological phenomenon of attachment to sunk costs as well as the more general principle of psychological commitment and consistency, people’s self-image and emotions become more and more invested in achieving a goal as total expenditures in pursuit of that goal increase. Therefore, as total project expenditures increase, clients will become more and more strongly biased toward reporting complete satisfaction with the consultants’ work and the project outcomes.”
In this statement there’s no possible confusion about the correlation being asserted: “as total project expenditures increase, clients will become more and more strongly biased toward reporting complete satisfaction.” So, we need to look for a positive correlation between Total Costs and Client Satisfaction Rate.
We can sort by either one of these two variables (for the same reason why it doesn’t matter which variable goes on the x-axis of a scatterplot, if we’re looking only for correlation). If we sort by Total Costs, the two columns of interest are as follows:
The positive correlation is obvious. (Note how all the percentages in the 80s come first, followed by all the ones in the 90s.) So this statement is Consistent with the table.
Part II: “The more consultants who work in a given office, the broader the range of their individual specialties and areas of expertise—and thus the greater the likelihood that each of the office’s projects will be staffed with consultants with the necessary competence and background to perform the work to the complete satisfaction of the client.”
The correlation ultimately being predicted here is between Number of Consultants (“the more consultants who work in a given office...”) and Client Satisfaction Rating (“...to the complete satisfaction of the client”). Sort by either of these and then check for the necessary (positive) correlation.
If we sort by Number of Consultants, the results are as follows:
Once again, the positive correlation is obvious. (Were it not for the 93% and 92% values coming out of order, the correlation here would be perfect.) This statement is also Consistent with the table.
Part III: “For some of the company’s projects, the client’s goals include intangible objectives, such as development of the client’s cross-cultural insight and leadership skills, in addition to revenue generation. Although these projects typically generate less revenue than those strictly focused on cash flow and profitability gains, they almost invariably receive perfect client satisfaction ratings.”
We have no information whatsoever about project goals, so the relevant correlation is between the other two metrics mentioned here: Average Project Revenue (“these projects typically generate less revenue”) and “client satisfaction ratings”. So, we need to sort the rows by one of these variables (once again it doesn’t particularly matter which one), and then check to see whether the resulting columns are ANTI-correlated (as one goes up, the other goes down).
Here’s what we get from sorting by Average Project Revenue:
Just like last time, the desired correlation is as close as possible to perfect without actually being perfect (marred only by the 92% and 91% figures coming out of order). So this statement, too, is very much Consistent with the table.
Correct answer:
According to the psychological phenomenon of attachment to sunk costs as well as the more general principle of psychological commitment and consistency, people’s self-image and emotions become more and more invested in achieving a goal as total expenditures in pursuit of that goal increase. Therefore, as total project expenditures increase, clients will become more and more strongly biased toward reporting complete satisfaction with the consultants’ work and the project outcomes. "Consistent"
The more consultants who work in a given office, the broader the range of their individual specialties and areas of expertise—and thus the greater the likelihood that each of the office’s projects will be staffed with consultants with the necessary competence and background to perform the work to the complete satisfaction of the client. "Consistent"
For some of the company’s projects, the client’s goals include intangible objectives, such as development of the client’s cross-cultural insight and leadership skills, in addition to revenue generation. Although these projects typically generate less revenue than those strictly focused on cash flow and profitability gains, they almost invariably receive perfect client satisfaction ratings. "Consistent"


