Events & Promotions
|
|

GMAT Club Daily Prep
Thank you for using the timer - this advanced tool can estimate your performance and suggest more practice questions. We have subscribed you to Daily Prep Questions via email.
Customized
for You
Track
Your Progress
Practice
Pays
Not interested in getting valuable practice questions and articles delivered to your email? No problem, unsubscribe here.
 May 08
08:00 AM PDT
-08:30 AM PDT
Join the special YouTube live-stream for selecting the winners of GMAT Club MBA Scholarships sponsored by Juno live. Watch who gets these coveted MBA scholarships offered by GMAT Club and Juno.

Kudos
Bookmarks
The Problem: Only 32-45% of students answer correlation questions correctly. Here's why: they see 1-2 outliers in the data and incorrectly conclude "no correlation," or they waste 2+ minutes analyzing every single data point.
The Solution: A 4-step process that takes 60-90 seconds max.
---
The 4-Step Correlation Method
Step 1: Identify the TWO Datasets
Correlation is ALWAYS between two variables. Read the question carefully and find which two columns you need to compare.
⚠️ GOTCHA: Column headers won't match the question wording exactly. "Number of public museums" might be labeled "Public ownership" in the table. Do mental translation.
Example Question: "There is a negative correlation between the number of self-check unlimited lanes and the average customer age."
The two datasets are: Self-check unlimited lanes and Average customer age
---
Step 2: Sort the Uglier Column
You MUST sort to assess directionality. But here's the trick most students miss:
💡 Sort the column with harder-to-read numbers (decimals, two-digit numbers). This lets you analyze the easier column with your eyes.

See the table above? Notice how we sorted by "Average Customer Age" (the column with decimals like 28.40, 29.90, 32.00...). Why? Because now we can quickly scan the "Self-Check Unlimited Lanes" column - those simple single-digit numbers (6, 8, 4, 4, 6, 0, 4, 0, 0) are much easier to observe patterns in.
The note says "easier to observe" - that's exactly the point! Sort the ugly column, observe the clean one.
---
Step 3: Use the Average Row to Spot the Pattern
Here's where most students waste time. Don't analyze every single number. Use the average row as your dividing line.
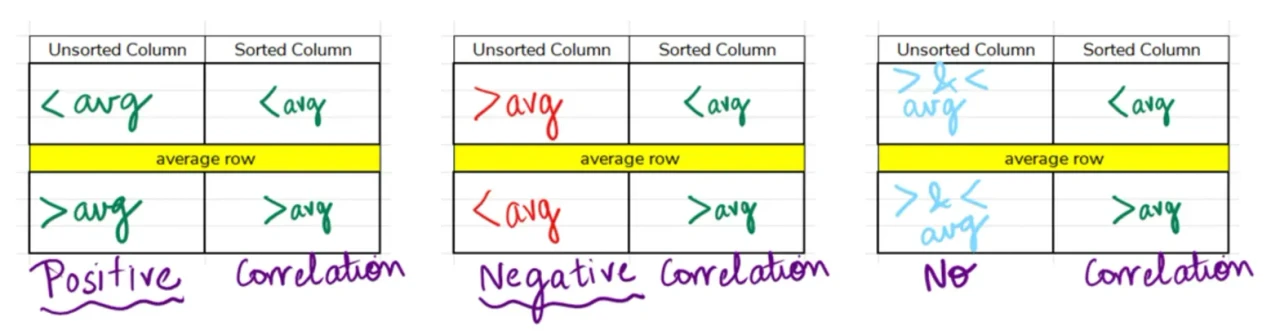
Look at the three scenarios above. This is your cheat sheet for instant pattern recognition.
In our example (refer back to the sorted table):
- Above the average row: Self-check lanes are 6, 8, 4, 4, 6 → ALL are larger than average (3.56)
- Below the average row: Self-check lanes are 0, 4, 0, 0 → THREE out of four are smaller than average (3.56)
What does this tell us? The unsorted column (lanes) has larger values at the top and smaller values at the bottom. But remember - we sorted the age column in ascending order (small to large), so ages are INCREASING as we go down.
Result: As age increases → lanes decrease = NEGATIVE correlation ✓ (This matches the middle scenario in the image above!)
⚡ POWER TIP: When there's an average row, just check if values flip from "mostly larger than average" to "mostly smaller than average" (or vice versa). That's your signal! Saves 15-20 seconds versus analyzing every number.
---
Step 4: Ignore 1-2 Outliers
Don't get paralyzed by imperfect data. Correlation means general trend, not every single point aligning perfectly.
In our table: Notice Store E (below the average row) has 4 lanes - that's above the average of 3.56, even though it has older customers (42.50 years). That's 1 outlier out of 9 stores.
8 out of 9 follow the trend = clear negative correlation.
Rule of thumb: If 4 out of 6 points follow the trend, you have correlation. If it's 3 vs 3, there's no correlation (like the third scenario in the image).
--
Why 68% of Students Get This Wrong
❌ TRAP #1: One outlier = no correlation
Students see one data point that doesn't fit and immediately select "No correlation."
Reality: 1-2 outliers are normal. Look at what the majority does. If 5 out of 6 points follow the trend, you have correlation.
❌ TRAP #2: Expecting perfect proportional increases
Students think correlation means numbers must increase by the same amount or maintain a constant ratio.
Reality: Correlation just means "general same/opposite direction movement." It's NOT about mathematical perfection or equal increases.
Key distinction: "Directly proportional" = perfect linear relationship. "Correlated" = general trend. GMAT tests correlation, not perfection.
Strategic insight: Correlation questions are often the FASTEST statements in Table Analysis once you have the method. Master this to bank time for harder Multi-Source Reasoning questions.
---
Want to Master This Live?
Join us this Wednesday, December 3rd at 9 PM IST for a free webinar where we'll walk through this method step-by-step, tackle real GMAT questions together, and show you how to own any dataset the test throws at you.
Perfect for students aiming for DI 83+ (90th percentile) and a 705+ overall score.
[Register Free on GMAT Club]
The Solution: A 4-step process that takes 60-90 seconds max.
---
The 4-Step Correlation Method
Step 1: Identify the TWO Datasets
Correlation is ALWAYS between two variables. Read the question carefully and find which two columns you need to compare.
⚠️ GOTCHA: Column headers won't match the question wording exactly. "Number of public museums" might be labeled "Public ownership" in the table. Do mental translation.
Example Question: "There is a negative correlation between the number of self-check unlimited lanes and the average customer age."
The two datasets are: Self-check unlimited lanes and Average customer age
---
Step 2: Sort the Uglier Column
You MUST sort to assess directionality. But here's the trick most students miss:
💡 Sort the column with harder-to-read numbers (decimals, two-digit numbers). This lets you analyze the easier column with your eyes.
See the table above? Notice how we sorted by "Average Customer Age" (the column with decimals like 28.40, 29.90, 32.00...). Why? Because now we can quickly scan the "Self-Check Unlimited Lanes" column - those simple single-digit numbers (6, 8, 4, 4, 6, 0, 4, 0, 0) are much easier to observe patterns in.
The note says "easier to observe" - that's exactly the point! Sort the ugly column, observe the clean one.
---
Step 3: Use the Average Row to Spot the Pattern
Here's where most students waste time. Don't analyze every single number. Use the average row as your dividing line.
Look at the three scenarios above. This is your cheat sheet for instant pattern recognition.
In our example (refer back to the sorted table):
- Above the average row: Self-check lanes are 6, 8, 4, 4, 6 → ALL are larger than average (3.56)
- Below the average row: Self-check lanes are 0, 4, 0, 0 → THREE out of four are smaller than average (3.56)
What does this tell us? The unsorted column (lanes) has larger values at the top and smaller values at the bottom. But remember - we sorted the age column in ascending order (small to large), so ages are INCREASING as we go down.
Result: As age increases → lanes decrease = NEGATIVE correlation ✓ (This matches the middle scenario in the image above!)
⚡ POWER TIP: When there's an average row, just check if values flip from "mostly larger than average" to "mostly smaller than average" (or vice versa). That's your signal! Saves 15-20 seconds versus analyzing every number.
---
Step 4: Ignore 1-2 Outliers
Don't get paralyzed by imperfect data. Correlation means general trend, not every single point aligning perfectly.
In our table: Notice Store E (below the average row) has 4 lanes - that's above the average of 3.56, even though it has older customers (42.50 years). That's 1 outlier out of 9 stores.
8 out of 9 follow the trend = clear negative correlation.
Rule of thumb: If 4 out of 6 points follow the trend, you have correlation. If it's 3 vs 3, there's no correlation (like the third scenario in the image).
--
Why 68% of Students Get This Wrong
❌ TRAP #1: One outlier = no correlation
Students see one data point that doesn't fit and immediately select "No correlation."
Reality: 1-2 outliers are normal. Look at what the majority does. If 5 out of 6 points follow the trend, you have correlation.
❌ TRAP #2: Expecting perfect proportional increases
Students think correlation means numbers must increase by the same amount or maintain a constant ratio.
Reality: Correlation just means "general same/opposite direction movement." It's NOT about mathematical perfection or equal increases.
Key distinction: "Directly proportional" = perfect linear relationship. "Correlated" = general trend. GMAT tests correlation, not perfection.
Strategic insight: Correlation questions are often the FASTEST statements in Table Analysis once you have the method. Master this to bank time for harder Multi-Source Reasoning questions.
---
Want to Master This Live?
Join us this Wednesday, December 3rd at 9 PM IST for a free webinar where we'll walk through this method step-by-step, tackle real GMAT questions together, and show you how to own any dataset the test throws at you.
Perfect for students aiming for DI 83+ (90th percentile) and a 705+ overall score.
[Register Free on GMAT Club]
Moderators:
197 posts