Events & Promotions
|
|

GMAT Club Daily Prep
Thank you for using the timer - this advanced tool can estimate your performance and suggest more practice questions. We have subscribed you to Daily Prep Questions via email.
Customized
for You
Track
Your Progress
Practice
Pays
Not interested in getting valuable practice questions and articles delivered to your email? No problem, unsubscribe here.
 May 20
08:00 AM PDT
-08:30 AM PDT
What’s in it for you- Live Profile Evaluation Chat Session with Jenifer Turtschanow, CEO, ARINGO. Come with your details prepared and ARINGO will share insights! Pre-MBA Role/Industry, YOE, Exam Score, C/GPA, ECs Post-MBA Role/ Industry & School List. Jun 10
06:00 AM PDT
-06:15 PM PDT
Register for the GMAT Club Virtual MBA Spotlight Fair – the world’s premier event for serious MBA candidates. This is your chance to hear directly from Admissions Directors at nearly every Top 30 MBA program..


Kudos
Bookmarks

Dropdown 1: Less than 25
Dropdown 2: D
Be sure to select an answer first to save it in the Error Log before revealing the correct answer (OA)!
Difficulty:
 95%
(hard)
95%
(hard)
Question Stats:
41% (02:42) correct 59%
(02:31)
wrong
based on 480
sessions
59%
(02:31)
wrong
based on 480
sessions
History
Date
Time
Result
Not Attempted Yet
Data Insights (DI) Butler 2023-24 [Question #114, Date: Nov-15-2023] [Click here for Details]
Survivorship curves show percent survival in a species or population as a function of age. In these curves the x-axis represents fraction of the maximum life-span for the species. Curve C represents a situation where individuals born in that population have an equal likelihood of dying at any age.
Attachment:
123.jpg [ 48.33 KiB | Viewed 5423 times ]
If the lifespan for species A is ten years, the probability that an individual will survive for more than 3 years after birth is percent.
Curve best represents a population of rabbits in which 50percent die in the first quarter of the lifespan, but after the first quarter have an approximately equal chance of dying at any age.
ShowHide Answer
Official Answer
Dropdown 1: Less than 25
Dropdown 2: D

Kudos
Bookmarks
Answer explanation:
If the lifespan for species A is ten years, the probability that an individual will survive for more than 3 years after birth is Less than 25 percent.
species A is ten years, the probability that an individual will survive for more than 3 years after birth >> life span is 3/10 = 30% >> look at X axis where X=30%, we will see that Y <25%


Kudos
Bookmarks
If the lifespan for species A is ten years, the probability that an individual will survive for more than 3 years after birth is [Less than 25] percent.
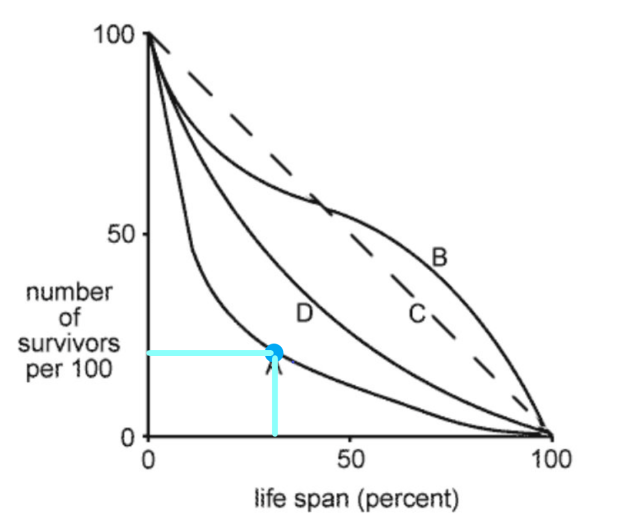
3 years out of 10 years = 30% life span
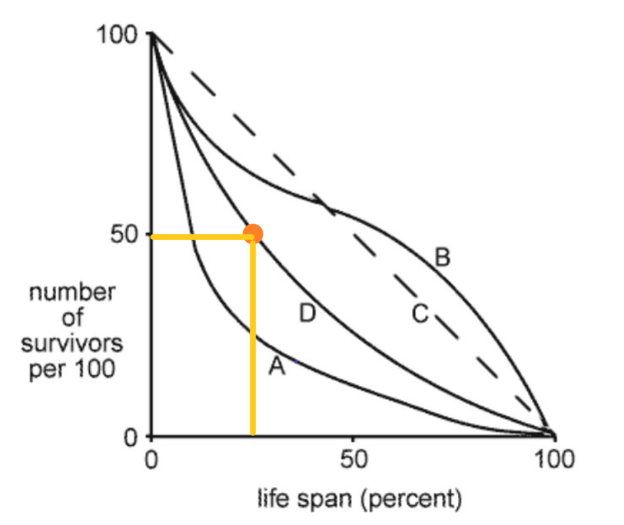
Curve [D] best represents a population of rabbits in which 50percent die in the first quarter of the lifespan, but after the first quarter have an approximately equal chance of dying at any age.

GMAT-Club-Forum-t2n164yo.png [ 79.15 KiB | Viewed 2042 times ]

GMAT-Club-Forum-d22t1gg7.png [ 79.71 KiB | Viewed 2046 times ]
3 years out of 10 years = 30% life span
Curve [D] best represents a population of rabbits in which 50percent die in the first quarter of the lifespan, but after the first quarter have an approximately equal chance of dying at any age.
Attachment:
GMAT-Club-Forum-t2n164yo.png [ 79.15 KiB | Viewed 2042 times ]
Attachment:
GMAT-Club-Forum-d22t1gg7.png [ 79.71 KiB | Viewed 2046 times ]


