Events & Promotions
|
|

GMAT Club Daily Prep
Thank you for using the timer - this advanced tool can estimate your performance and suggest more practice questions. We have subscribed you to Daily Prep Questions via email.
Customized
for You
Track
Your Progress
Practice
Pays
Not interested in getting valuable practice questions and articles delivered to your email? No problem, unsubscribe here.
 Sep 28
07:00 PM EDT
-10:00 PM EDT
Boost your GMAT score in less than one month in a live online class + 6 months access to TTP OnDemand video courses included! Class starts Mon, Tues, Wed, Thur, Fri Sept. 28, 2026 - Oct. 16, 2027, 7:00pm-10:00pm EST Sep 29
11:00 AM EDT
-01:00 PM EDT
" Description: Top scores are possible when you enroll in a powerful GMAT course, taught live online + 6 months access to TTP OnDemand video courses included! Class starts Tues/Thur Sept. 29, 2026 - Dec. 3, 2026, 11:00am-1:00pm EST Oct 01
07:00 AM BST
-08:00 AM GMT
Welcome to the GMAT Club's Free Interview Prep Event for Top MBA Programs! Buy tickets - Virtual series that’s all set to equip you to -excel in your MBA interviews. Oct 03
01:00 PM EDT
-04:00 PM EDT
Top scores are possible when you enroll in a powerful GMAT course, taught live online + 6 months access to TTP OnDemand video courses included! Class starts Saturdays Oct. 3, 2026 - Dec. 26, 2026, 1:00pm-4:00pm EST


Dropdown 1: Recreational places
Dropdown 2: 55%
Be sure to select an answer first to save it in the Error Log before revealing the correct answer (OA)!
Difficulty:
 95%
(hard)
95%
(hard)
Question Stats:
58% (02:51) correct 42%
(03:02)
wrong
based on 374
sessions
42%
(03:02)
wrong
based on 374
sessions
History
Date
Time
Result
Not Attempted Yet
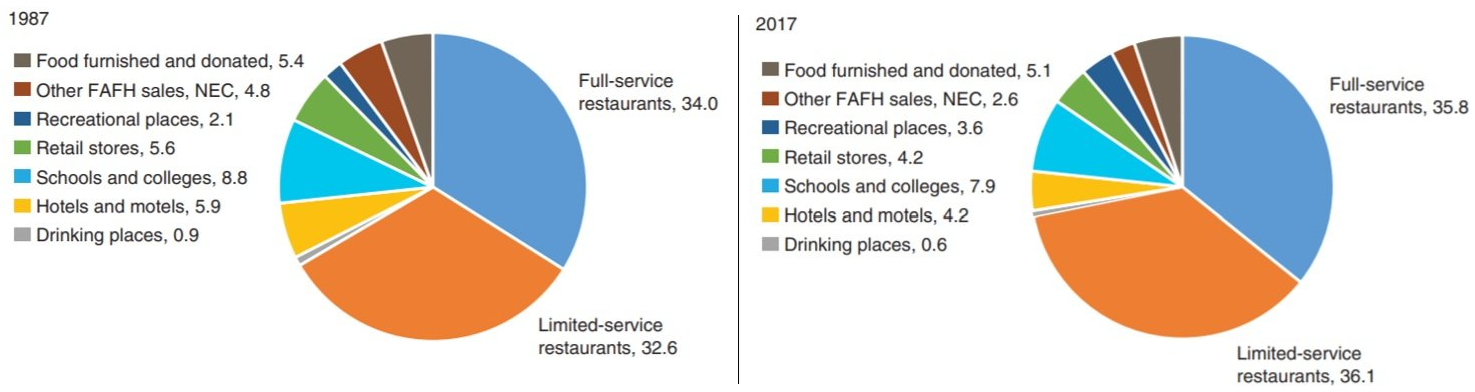
The figure illustrates the percentages of food away from home (FAFH) expenditures by outlet type in 1987 and 2017. The acronym NEC stands for "not elsewhere classified." All estimates include both sales taxes and tips.
Select from each drop-down menu the option that creates the most accurate statement, given the information provided.
If FAFH expenditures did not decrease from 1987 to 2017, the category with the greatest percentage increase in expenditures over the 30-year period is .
If expenditures classified into the "Other FAFH sales, NEC" category in 2017 were equally distributed among the other eight categories, the category with the highest percentage increase in share would see an increase of approximately .
Attachment:
12.jpg [ 106.69 KiB | Viewed 7839 times ]
ShowHide Answer
Official Answer
Dropdown 1: Recreational places
Dropdown 2: 55%
 22 Nov 2024, 05:14
Kudos
Bookmarks
Bunuel
Official Solution:
Drop-down 1:
We should focus on the category with the largest increase in share. Recreational Places experienced the greatest increase, with its share rising from 2.1% to 3.6%, representing a 1.7-fold increase. This means the actual increase in expenditures for this category would be 1.7 * (the increase in total expenditures). For instance, if total expenditures doubled, expenditures for Recreational Places would increase by 1.7 * 2 = 3.4 times.
Drop-down 2:
In 2017, "Other FAFH sales, NEC" accounted for 2.6% of the total expenditure. Distributing this share evenly among the other eight categories would add approximately \(\frac{2.6}{8} \approx 0.33\) percentage points to each. The category with the highest percentage increase in share would be the one with the smallest initial share, which is Drinking Places, with an initial share of 0.6%. The percentage increase in share, therefore, would be \(\frac{0.33}{0.6} * 100 = 55\%\).
Correct answer:
Dropdown 1: "Recreational places"
Dropdown 2: "55%"
 15 Sep 2026, 08:31
Kudos
Bookmarks
Hi Bunnel,
For the first dropdown shouldn't the answer be limited service resturants with a percentage change of 3.5 as the multiplication factor?
For the first dropdown shouldn't the answer be limited service resturants with a percentage change of 3.5 as the multiplication factor?
Bunuel