Events & Promotions
|
|

GMAT Club Daily Prep
Thank you for using the timer - this advanced tool can estimate your performance and suggest more practice questions. We have subscribed you to Daily Prep Questions via email.
Customized
for You
Track
Your Progress
Practice
Pays
Not interested in getting valuable practice questions and articles delivered to your email? No problem, unsubscribe here.
 May 20
08:00 AM PDT
-08:30 AM PDT
What’s in it for you- Live Profile Evaluation Chat Session with Jenifer Turtschanow, CEO, ARINGO. Come with your details prepared and ARINGO will share insights! Pre-MBA Role/Industry, YOE, Exam Score, C/GPA, ECs Post-MBA Role/ Industry & School List. Jun 10
06:00 AM PDT
-06:15 PM PDT
Register for the GMAT Club Virtual MBA Spotlight Fair – the world’s premier event for serious MBA candidates. This is your chance to hear directly from Admissions Directors at nearly every Top 30 MBA program..


Dropdown 1: 4
Dropdown 2: 38%
Be sure to select an answer first to save it in the Error Log before revealing the correct answer (OA)!
Difficulty:
 95%
(hard)
95%
(hard)
Question Stats:
48% (03:28) correct 52%
(03:43)
wrong
based on 436
sessions
52%
(03:43)
wrong
based on 436
sessions
History
Date
Time
Result
Not Attempted Yet
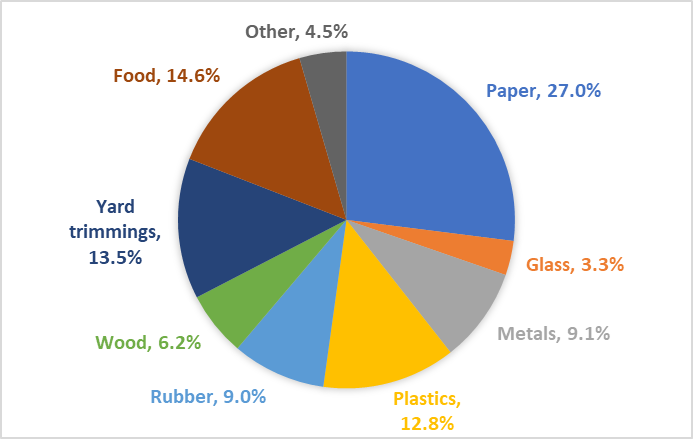
The graph above shows the proportions of 9 material categories comprising 254 million tons of municipal solid waste in 2013 before potential recycling.
Select from each drop-down menu the option that creates the most accurate statement based on the information provided.
If 50% of paper waste and 35% of metal waste were recycled in 2013, then the amount of recycled paper, in tons, would be approximately times that of recycled metal waste.
If the weight of plastic waste remained the same in 2014 while the weight of total waste increased by 10% from 2013 to 2014, and the increase in tons was evenly distributed across the other eight categories, then a increase would represent the greatest percent increase in tons of waste for any of the eight categories from 2013 to 2014.
Attachment:
6.jpg [ 61.19 KiB | Viewed 8792 times ]
ShowHide Answer
Official Answer
Dropdown 1: 4
Dropdown 2: 38%
Kudos
Bookmarks
Bunuel
Drop-down 1:
Paper waste contributes 27% of the total waste. Since 50% of that was recycled, 13.5% of paper waste was recycled. Metal waste contributes 9.1% of the total waste. Since 35% of that was recycled, approximately 3.2% of metal waste was recycled. Therefore, the amount of recycled paper was approximately \(\frac{13.5}{3.2} \approx 4.2\) times that of recycled metal waste.
Drop-down 1:
The total waste increased by 10% from 2013 to 2014, accounting for a 25.4 million ton increase in total waste. Since this increase was evenly distributed across the eight categories, each category increased by \(\frac{25.4}{8} \approx 3.2\) million tons of waste. The addition of 3.2 million tons would result in the greatest percentage increase for the waste category with the least waste in 2013. That category was Glass, which accounted for 3.3% of 254 million tons, approximately 8.4 million tons. The increase of 3.2 million tons would constitute an increase of \(\frac{3.2}{8.4} * 100 \approx 38\%\).
Correct answer:
Dropdown 1: "4"
Dropdown 2: "38%"

Kudos
Bookmarks
1. The amount of recycled paper waste would be equal to \(50\% * 27\% * 254 = 34.29\) million tons and the amount of recycled metal waste would be equal to \(35\% * 9.1\% * 254 = 8.0899\) million tons. The ratio is equal to \(\frac{34.29}{8.0899} \approx 4.24\), which is closest to 4.
2. A 10% increase distributed over 8 categories is the same as \(10\% * 254 * \frac{1}{8} = 3.175\) million tons being distributed to each category apart from plastic waste. This would be the greatest percent increase for the category with the smallest amount - glass, which would go from \(3.3\% * 254 = 8.382\) to \(8.382 + 3.175 = 11.557\) million tons. This is a \(\frac{3.175}{8.382} * 100\% \approx 37.88\%\), which is closest to 38%.
3. Our answer will be: 4 and 38%.


