Events & Promotions
|
|

GMAT Club Daily Prep
Thank you for using the timer - this advanced tool can estimate your performance and suggest more practice questions. We have subscribed you to Daily Prep Questions via email.
Customized
for You
Track
Your Progress
Practice
Pays
Not interested in getting valuable practice questions and articles delivered to your email? No problem, unsubscribe here.
 Jun 06
12:30 AM EDT
-01:30 AM EDT
Struggling to find the right strategies to score a 99 %ile on GMAT Focus? Riya (GMAT 715) boosted her score by 100-points in just 15 days! Discover how the right mentorship, tailored strategies, and an unwavering mindset can transform your GMAT prep. Jun 07
01:30 AM EDT
-02:30 AM EDT
Learn how Kamakshi achieved a GMAT 675 with an impressive 96th %ile in Data Insights. Discover the unique methods and exam strategies that helped her excel in DI along with other sections for a balanced and high score. Jun 08
03:00 PM PDT
-04:00 PM PDT
15 Full-length GMAT FE mocks with insightful analytics, weakness diagnosis, and video explanations! Jun 08
08:00 PM EDT
-10:00 PM EDT
A powerful GMAT course taught live online + 6 months of access to TTP OnDemand GMAT Masterclass included! Mon/Wed June 8, 2026 →August 12, 2026 8:00pm-10:00pm EST Jun 10
06:00 AM PDT
-06:15 PM PDT
Register for the GMAT Club Virtual MBA Spotlight Fair – the world’s premier event for serious MBA candidates. This is your chance to hear directly from Admissions Directors at nearly every Top 30 MBA program.. Jun 11
11:00 AM EDT
-01:00 PM EDT
TTP GMAT OnDemand gives serious students 400+ hours of expert video instruction, the full TTP course, AI support, weekly office hours, and a 715+ score guarantee—all built for elite GMAT score improvement.

Kudos
Bookmarks

Dropdown 1: More than 100
Dropdown 2: decreased
Be sure to select an answer first to save it in the Error Log before revealing the correct answer (OA)!
Difficulty:
 75%
(hard)
75%
(hard)
Question Stats:
57% (02:16) correct 43%
(02:10)
wrong
based on 2098
sessions
43%
(02:10)
wrong
based on 2098
sessions
History
Date
Time
Result
Not Attempted Yet
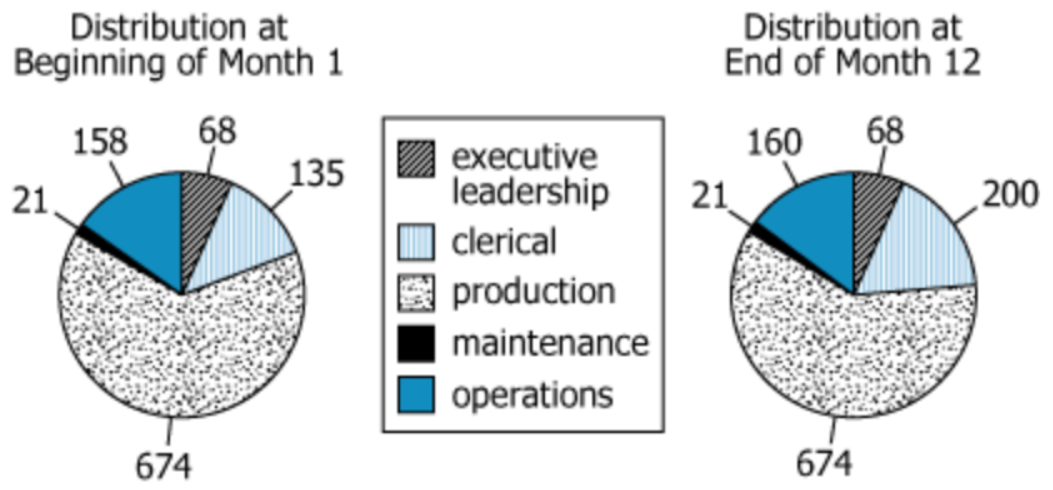
Categories: The circle graphs show the number of employees in each of Company Z’s five employee categories at the beginning and end of a 12-month period. Each employee was in exactly one of the categories, and no employee moved from any category to any other.
Departures: During the same 12-month period, 145 employees left Company Z. None of those who left returned to Company Z.
Based on the information provided, select from each drop-down menu the option that creates the most accurate statement.
new employees joined the company during the 12-month period, and the percentage of Company Z employees who were in the executive leadership category during that period.

GMAT-Club-Forum-3xlg17y0.png [ 285.77 KiB | Viewed 6574 times ]
Categories: The circle graphs show the number of employees in each of Company Z’s five employee categories at the beginning and end of a 12-month period. Each employee was in exactly one of the categories, and no employee moved from any category to any other.
Departures: During the same 12-month period, 145 employees left Company Z. None of those who left returned to Company Z.
Based on the information provided, select from each drop-down menu the option that creates the most accurate statement.
new employees joined the company during the 12-month period, and the percentage of Company Z employees who were in the executive leadership category during that period.
Official Mock No. 5


Attachment:
GMAT-Club-Forum-3xlg17y0.png [ 285.77 KiB | Viewed 6574 times ]
ShowHide Answer
Official Answer
Dropdown 1: More than 100
Dropdown 2: decreased
Using official mocks already?
Add GMAT Club Tests for harder practice, analytics, and explanations without overlapping Official Guide or official mock questions.
Try it now →
Try it now →

pranjalshah
Joined: 11 Dec 2023
Last visit: 04 Feb 2026
Posts: 103
Given Kudos: 202
Location: India
Concentration: Operations, General Management
Schools: ISB '27 (A$$$$)
GMAT Focus 1: 735 Q90 V87 DI82 
Kudos
Bookmarks
Total employees at the start = 674+21+158+68+135
Total employees at the end = 674+21+160+68+200
Difference = (160-158)+(200-135) = 67
There are 67 more employees at the end of month 12, despite 145 employees leaving. Therefore total new joiners = 145+67 = more than 100.
and since no of employees in executive leadership remains constant even after the total number of employees has increased, therefore there's a % decrease.
General Discussion

Kudos
Bookmarks


