Events & Promotions
|
|

GMAT Club Daily Prep
Thank you for using the timer - this advanced tool can estimate your performance and suggest more practice questions. We have subscribed you to Daily Prep Questions via email.
Customized
for You
Track
Your Progress
Practice
Pays
Not interested in getting valuable practice questions and articles delivered to your email? No problem, unsubscribe here.
 May 18
10:00 AM PDT
-11:00 AM PDT
Join us in a live GMAT practice session and solve 25 challenging GMAT questions with other test takers in timed conditions, covering GMAT Quant, Data Sufficiency, Data Insights, Reading Comprehension, and Critical Reasoning questions. May 12
12:00 PM EDT
-11:59 PM EDT
Make the most of your break with the most realistic GMAT™ prep. Take up to $700 off select products. Ends 6/1 May 15
01:00 PM IST
-11:00 AM IST
Start your journey with a fully customized action plan and work with a dedicated mentor to achieve a 735+ score.- May 19
12:00 PM PDT
-01:00 PM PDT
Scoring 329 on the GRE is not always about using more books, more courses, or a longer study plan. In this episode of GRE Success Talks, Ashutosh shares his GRE preparation strategy, study plan, and test-day experience, explaining how he kept his prep.... - Jun 10
06:00 AM PDT
-06:15 PM PDT
Register for the GMAT Club Virtual MBA Spotlight Fair – the world’s premier event for serious MBA candidates. This is your chance to hear directly from Admissions Directors at nearly every Top 30 MBA program..

Kudos
Bookmarks

Dropdown 1: More than 100
Dropdown 2: decreased
Be sure to select an answer first to save it in the Error Log before revealing the correct answer (OA)!
Difficulty:
 75%
(hard)
75%
(hard)
Question Stats:
57% (02:16) correct 43%
(02:09)
wrong
based on 2015
sessions
43%
(02:09)
wrong
based on 2015
sessions
History
Date
Time
Result
Not Attempted Yet
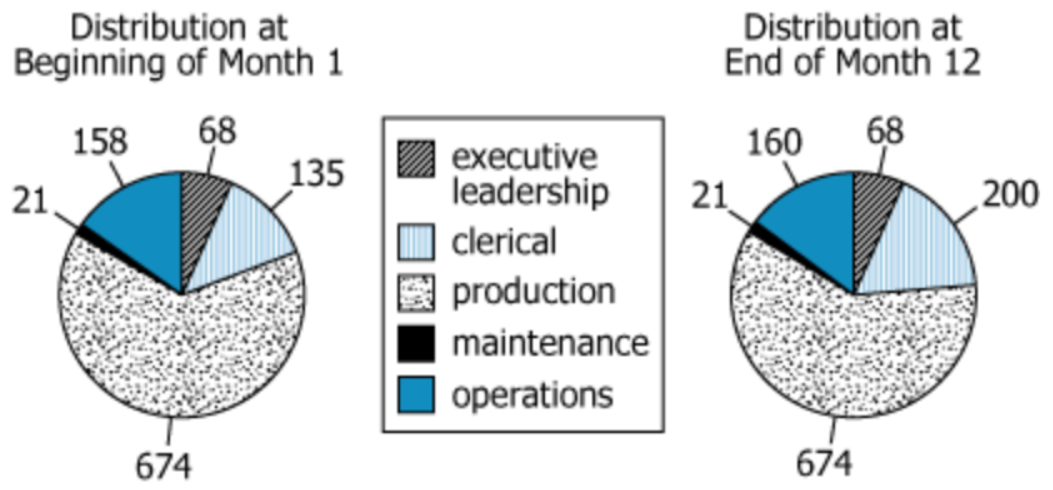
Categories: The circle graphs show the number of employees in each of Company Z’s five employee categories at the beginning and end of a 12-month period. Each employee was in exactly one of the categories, and no employee moved from any category to any other.
Departures: During the same 12-month period, 145 employees left Company Z. None of those who left returned to Company Z.
Based on the information provided, select from each drop-down menu the option that creates the most accurate statement.
new employees joined the company during the 12-month period, and the percentage of Company Z employees who were in the executive leadership category during that period.

GMAT-Club-Forum-3xlg17y0.png [ 285.77 KiB | Viewed 6237 times ]
Categories: The circle graphs show the number of employees in each of Company Z’s five employee categories at the beginning and end of a 12-month period. Each employee was in exactly one of the categories, and no employee moved from any category to any other.
Departures: During the same 12-month period, 145 employees left Company Z. None of those who left returned to Company Z.
Based on the information provided, select from each drop-down menu the option that creates the most accurate statement.
new employees joined the company during the 12-month period, and the percentage of Company Z employees who were in the executive leadership category during that period.
Official Mock No. 5


Attachment:
GMAT-Club-Forum-3xlg17y0.png [ 285.77 KiB | Viewed 6237 times ]
ShowHide Answer
Official Answer
Dropdown 1: More than 100
Dropdown 2: decreased
Pro tip:
Combine official questions for familiarity with GMAT Club Tests for analytics and tougher Focus-level practice so the real exam feels manageable.
Explore →

pranjalshah
Joined: 11 Dec 2023
Last visit: 04 Feb 2026
Posts: 103
Given Kudos: 202
Location: India
Concentration: Operations, General Management
Schools: ISB '27 (A$$$$)
GMAT Focus 1: 735 Q90 V87 DI82 
Kudos
Bookmarks
Total employees at the start = 674+21+158+68+135
Total employees at the end = 674+21+160+68+200
Difference = (160-158)+(200-135) = 67
There are 67 more employees at the end of month 12, despite 145 employees leaving. Therefore total new joiners = 145+67 = more than 100.
and since no of employees in executive leadership remains constant even after the total number of employees has increased, therefore there's a % decrease.
General Discussion

Kudos
Bookmarks


