Events & Promotions
|
|

GMAT Club Daily Prep
Thank you for using the timer - this advanced tool can estimate your performance and suggest more practice questions. We have subscribed you to Daily Prep Questions via email.
Customized
for You
Track
Your Progress
Practice
Pays
Not interested in getting valuable practice questions and articles delivered to your email? No problem, unsubscribe here.
 May 01
11:00 AM PDT
-12:00 PM PDT
Free- full-length test + 15 concept videos + 150+ short videos + study plan! May 03
12:30 AM EDT
-01:30 AM EDT
Learn how Kamakshi achieved a GMAT 675 with an impressive 96th %ile in Data Insights. Discover the unique methods and exam strategies that helped her excel in DI along with other sections for a balanced and high score.


Kudos
Bookmarks

Dropdown 1: 30%
Dropdown 2: 2
Be sure to select an answer first to save it in the Error Log before revealing the correct answer (OA)!
Difficulty:
 45%
(medium)
45%
(medium)
Question Stats:
71% (03:03) correct 29%
(03:10)
wrong
based on 632
sessions
29%
(03:10)
wrong
based on 632
sessions
History
Date
Time
Result
Not Attempted Yet
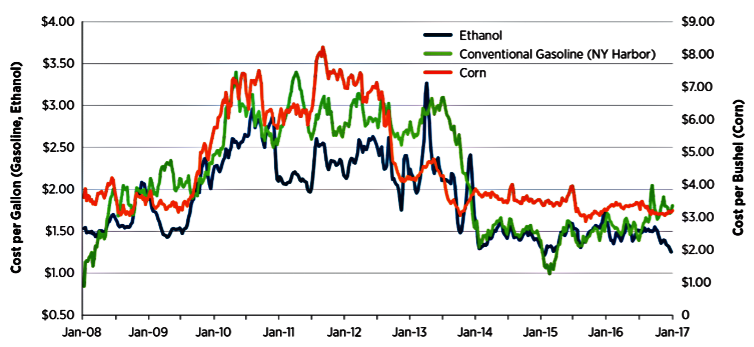
The graph compares the cost of ethanol and gasoline in the United States with the cost of corn over a period of time. Ethanol and gasoline costs are shown on the left vertical axis, and corn costs are shown on the right vertical axis.
Select from each drop-down menu the option that creates the most accurate statement, given the information provided.
When the cost of corn was at its highest, the cost per gallon of ethanol was approximately of the cost per bushel of corn.
The range of costs for corn was approximately times greater than the range of costs for gasoline.
ShowHide Answer
Official Answer
Dropdown 1: 30%
Dropdown 2: 2
Kudos
Bookmarks
Bunuel
Official Solution:
Drop-down 1:
The cost of corn, represented by the red line, was at its highest at the end of 2011, reaching approximately $8.30 per bushel (use right axis for the cost of corn). At the same time, the cost of ethanol, black line, was about $2.50 per gallon, which is \(\frac{2.5}{8.3}*100 \approx 30\%\) of the cost per bushel of corn.
Drop-down 2:
The highest cost for corn was at the end of 2011, reaching approximately $8.30 per bushel, while the lowest cost for corn was at the end of 2015, dropping to approximately $2.90 per bushel, resulting in a range of $5.40. The highest cost for gasoline was at the beginning of 2010, reaching approximately $3.40 per gallon, while the lowest cost for gasoline was at the beginning of 2008, at $0.60 per gallon, resulting in a range of $2.80. Therefore, the range of corn was approximately \(\frac{5.4}{2.8} \approx 2\) times the range of gasoline.
Correct answer:
Dropdown 1: "30%"
Dropdown 2: "2"
General Discussion

Kudos
Bookmarks
How much time should one be taking to answer this question? It took me close to 3.5 mins.