Events & Promotions
|
|

GMAT Club Daily Prep
Thank you for using the timer - this advanced tool can estimate your performance and suggest more practice questions. We have subscribed you to Daily Prep Questions via email.
Customized
for You
Track
Your Progress
Practice
Pays
Not interested in getting valuable practice questions and articles delivered to your email? No problem, unsubscribe here.
 May 06
08:30 AM PDT
-09:30 AM PDT
In Episode 3 of our GMAT Ninja Critical Reasoning series, we tackle Discrepancy, Paradox, and Explain an Oddity questions. You know the feeling: the passage gives you two facts that seem completely contradictory.... May 07
01:00 AM EDT
-02:00 AM EDT
Learn how Keshav, a Chartered Accountant, scored an impressive 705 on GMAT in just 30 days with GMATWhiz's expert guidance. In this video, he shares preparation tips and strategies that worked for him, including the mock, time management, and..... May 06
12:30 AM EDT
-01:30 AM EDT
GMAT 615 to 715 in Just 15 Days! Riya’s 100-pt Improvement Strategy- May 08
08:00 AM PDT
-08:30 AM PDT
Join the special YouTube live-stream for selecting the winners of GMAT Club MBA Scholarships sponsored by Juno live. Watch who gets these coveted MBA scholarships offered by GMAT Club and Juno.  May 08
08:00 PM PDT
-09:00 PM PDT
Free- full-length test + 15 concept videos + 150+ short videos + study plan!


Kudos
Bookmarks

Dropdown 1: 0.05
Dropdown 2: 0.35
Be sure to select an answer first to save it in the Error Log before revealing the correct answer (OA)!
Difficulty:
 35%
(medium)
35%
(medium)
Question Stats:
76% (02:21) correct 24%
(02:35)
wrong
based on 180
sessions
24%
(02:35)
wrong
based on 180
sessions
History
Date
Time
Result
Not Attempted Yet
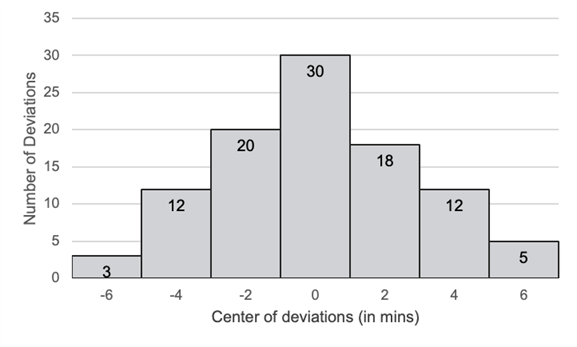
For a small city, the graph represents the daily deviation, in minutes, of a commuter’s travel time from the expected commute time for each day in a 100-day period. Data is grouped into disjoint classes of deviations: for each value of T marked on the horizontal axis, the class centered at T includes all observed deviations greater than or equal to (T−1) minutes but less than (T+1) minutes. The height of each bar represents the number of deviations in the corresponding class. A given day’s commute is said to be x minutes shorter than normal if it is x minutes less than the left endpoint of the class centered at 0, and x minutes longer than normal if it is x minutes greater than the right endpoint of the class centered at 0.
From each drop-down menu, select the option that creates the most accurate statement based on the information provided.
For a randomly selected day in this 100-day period, the probability that the commute time was at least 5 minutes longer than normal is , and the probability that the commute time was at least 1 minute longer than normal is .

GMAT-Club-Forum-6dgokq2c.png [ 23.44 KiB | Viewed 1982 times ]
From each drop-down menu, select the option that creates the most accurate statement based on the information provided.
For a randomly selected day in this 100-day period, the probability that the commute time was at least 5 minutes longer than normal is , and the probability that the commute time was at least 1 minute longer than normal is .
Attachment:
GMAT-Club-Forum-6dgokq2c.png [ 23.44 KiB | Viewed 1982 times ]
ShowHide Answer
Official Answer
Dropdown 1: 0.05
Dropdown 2: 0.35

Kudos
Bookmarks
Shouldn't the question say 100 day period instead of 90? really threw me off for a second there.
Kudos
Bookmarks
Bunuel
Solution:
Class centered at 0 includes deviations from -1 to +1 minutes.
1. Probability that commute time was at least 5 minutes longer than normal:
Corresponds to:
Class centered at 6 → 5 days
Total = 17 days
Probability = 5 / 100 = 5%
2. Probability that commute time was at least 1 minutes longer than normal:
Corresponds to:
Class centered at 2 → 18 days
Class centered at 4 → 12 days
Class centered at 6 → 5 days
Total = 18 + 12 + 5 = 35 days
Probability = 35 / 100 = 35%