Events & Promotions
|
|

GMAT Club Daily Prep
Thank you for using the timer - this advanced tool can estimate your performance and suggest more practice questions. We have subscribed you to Daily Prep Questions via email.
Customized
for You
Track
Your Progress
Practice
Pays
Not interested in getting valuable practice questions and articles delivered to your email? No problem, unsubscribe here.
 May 01
11:00 AM PDT
-12:00 PM PDT
Free- full-length test + 15 concept videos + 150+ short videos + study plan! Apr 30
01:30 AM EDT
-02:30 AM EDT
At one point, she believed GMAT wasn’t for her. After scoring 595, self-doubt crept in and she questioned her potential. But instead of quitting, she made the right strategic changes. The result? A remarkable comeback to 695. Check out how Saakshi did it. May 03
06:30 AM PDT
-08:30 AM PDT
Verbal trouble on GMAT? Fix it NOW! Join Sunita Singhvi for a focused webinar on actionable strategies to boost your Verbal score and take your performance to the next level.


Kudos
Bookmarks

Dropdown 1: 310,000
Dropdown 2: 60%
Be sure to select an answer first to save it in the Error Log before revealing the correct answer (OA)!
Difficulty:
 55%
(hard)
55%
(hard)
Question Stats:
67% (02:01) correct 33%
(02:06)
wrong
based on 525
sessions
33%
(02:06)
wrong
based on 525
sessions
History
Date
Time
Result
Not Attempted Yet
The waterfall chart below illustrates the impact of various business activities on a company’s cash position over the course of a fiscal year. The company begins the year with €500,000 in cash. The chart displays a series of cumulative changes, both positive and negative, arising from seven business activities, ultimately leading to the year-end cash balance.
Positive values (e.g., Product Sales) indicate cash inflows, while negative values (e.g., Salaries) represent cash outflows.
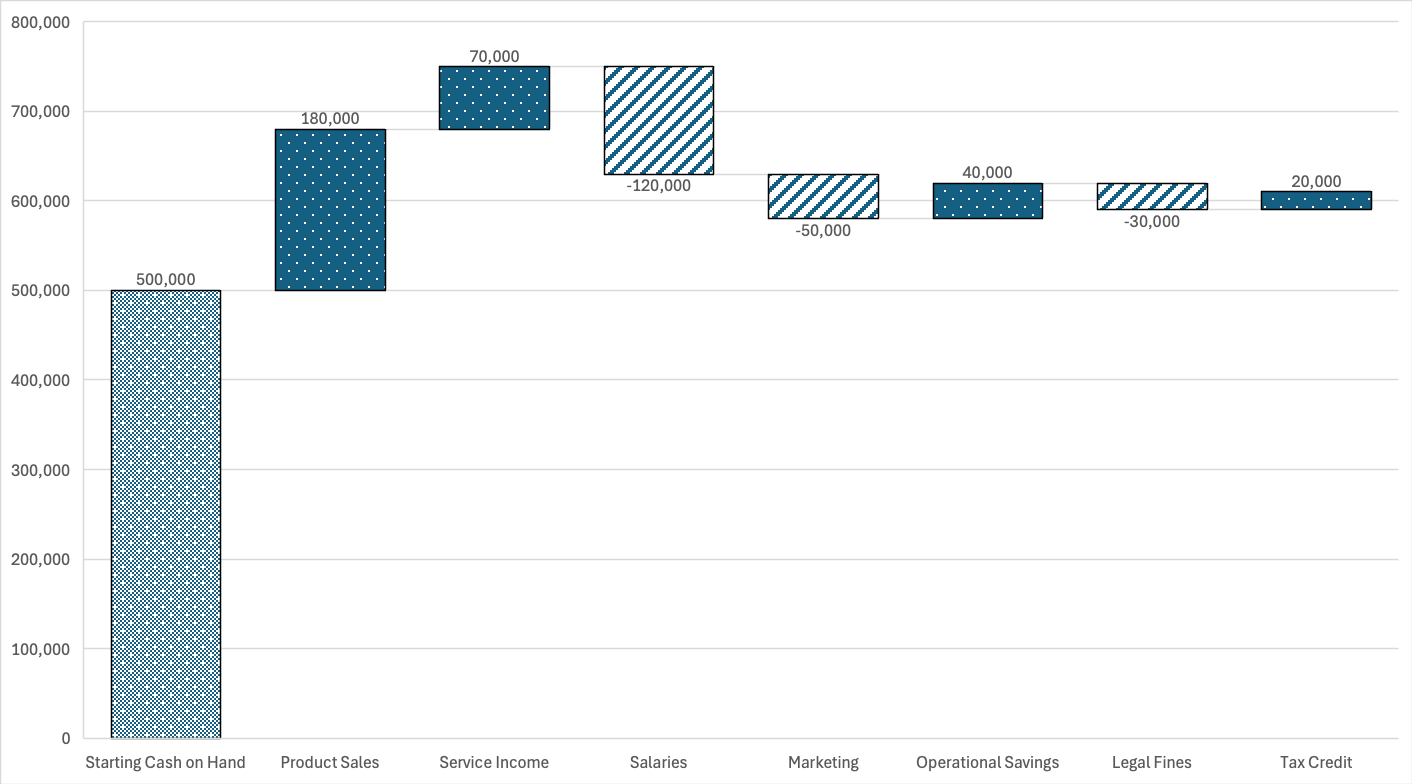
Based on the information in the chart, the total contribution (in euros) from all cash inflow activities to the year-end cash balance is € , and the percentage of total cash outflows attributable to Salaries is closest to .

GMAT-Club-Forum-w599nx6a.png [ 33.57 KiB | Viewed 2471 times ]

GMAT-Club-Forum-jqh0yz7f.png [ 51.71 KiB | Viewed 2192 times ]

GMAT-Club-Forum-k410kkhc.png [ 55.85 KiB | Viewed 2050 times ]
Positive values (e.g., Product Sales) indicate cash inflows, while negative values (e.g., Salaries) represent cash outflows.
Based on the information in the chart, the total contribution (in euros) from all cash inflow activities to the year-end cash balance is € , and the percentage of total cash outflows attributable to Salaries is closest to .
Attachment:
GMAT-Club-Forum-w599nx6a.png [ 33.57 KiB | Viewed 2471 times ]
Attachment:
GMAT-Club-Forum-jqh0yz7f.png [ 51.71 KiB | Viewed 2192 times ]
Attachment:
GMAT-Club-Forum-k410kkhc.png [ 55.85 KiB | Viewed 2050 times ]
ShowHide Answer
Official Answer
Dropdown 1: 310,000
Dropdown 2: 60%

PietroCavallo
Joined: 04 Jun 2024
Last visit: 28 Apr 2026
Posts: 9
Given Kudos: 30
Location: Italy
Schools: CBS '26 (A) Stern '26 (M$$$$) HBS '26 (D)
GMAT Focus 1: 725 Q84 V86 DI88 
GPA: 3.65
Kudos
Bookmarks
catinabox
Question, if we talk about 'net contribution' I'm inclined to think that it's only the portion exceeding expenses (e.g., 110). Why it's not simply written 'what is the contribution'? Is this ambiguity also expected on the exam?
Thanks
Question, if we talk about 'net contribution' I'm inclined to think that it's only the portion exceeding expenses (e.g., 110). Why it's not simply written 'what is the contribution'? Is this ambiguity also expected on the exam?
Thanks


Kudos
Bookmarks
I have made some edits to the overall question including the graph.
PietroCavallo