Events & Promotions
|
|

GMAT Club Daily Prep
Thank you for using the timer - this advanced tool can estimate your performance and suggest more practice questions. We have subscribed you to Daily Prep Questions via email.
Customized
for You
Track
Your Progress
Practice
Pays
Not interested in getting valuable practice questions and articles delivered to your email? No problem, unsubscribe here.
 Sep 07
12:01 AM PDT
-11:59 PM PDT
On the 7th, GMAT Club Tests will be Free! Including all the Quizzes, Questions, and Tests. 12 AM - 11:59 PM PDT- Sep 09
07:00 AM PDT
-10:00 AM PDT
Meet AdComs and explore top Master’s programs - MiM, MiF, MSc, MSBA and more. - Application Fee Waivers - Free 1-Week of GMAT Club Tests: - Master's Application Toolkit - Grand Prize Giveaway


 21 Dec 2019, 09:31
Kudos
Bookmarks


The number of times the cardio rooms were accessed per member, on average, in Year 2 represented an increase from Year 1.: No
The ratio of cardio equipment available to total pieces of equipment available was greater in Year 6 than in any other year.: No
The ratio of strength equipment available to total equipment available in Year 3 was greater than the ratio of strength equipment room accesses to total room accesses in the same year.: Yes
Be sure to select an answer first to save it in the Error Log before revealing the correct answer (OA)!
Difficulty:
 75%
(hard)
75%
(hard)
Question Stats:
73% (03:45) correct 27%
(03:48)
wrong
based on 734
sessions
27%
(03:48)
wrong
based on 734
sessions
History
Date
Time
Result
Not Attempted Yet
At the end of each of seven years, a small chain of health clubs reported how many total pieces of exercise equipment it had available for use at its locations. It also reported how many pieces of two specific types of equipment (strength equipment and cardio equipment) it had available. Additionally, it tracked the number of times during each year that club members accessed all of the equipment rooms, as well as in particular the strength machine rooms and cardio machine rooms, which housed their respective types of equipment.
(Sort ↕ the table by clicking on the headers)
For each of the following statements, select Yes if the statement can be shown to be true with the information provided. Otherwise, select No.
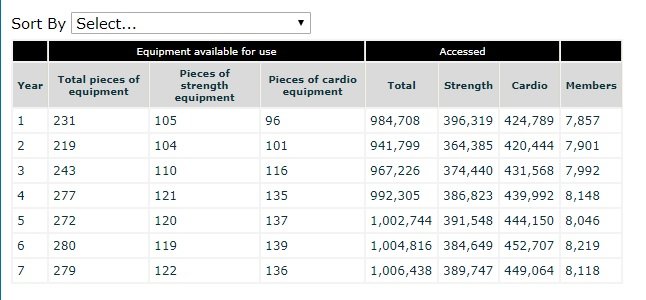
Tab.jpg [ 66.19 KiB | Viewed 7574 times ]
Equipment available for use | Accessed | ||||||||||
| Year | Total pieces of equipment | Pieces of strength equipment | Pieces of cardio equipment | Total | Strength | Cardio | Members | ||||
|---|---|---|---|---|---|---|---|---|---|---|---|
| 1 | 231 | 105 | 96 | 984708 | 396319 | 424789 | 7857 | ||||
| 2 | 219 | 104 | 101 | 941799 | 364385 | 420444 | 7901 | ||||
| 3 | 243 | 110 | 116 | 967226 | 374440 | 431568 | 7992 | ||||
| 4 | 277 | 121 | 135 | 992305 | 386823 | 439992 | 8148 | ||||
| 5 | 272 | 120 | 137 | 1002744 | 391548 | 444150 | 8046 | ||||
| 6 | 280 | 119 | 139 | 1004816 | 384649 | 452707 | 8219 | ||||
| 7 | 279 | 122 | 136 | 1006438 | 389747 | 449064 | 8118 | ||||
For each of the following statements, select Yes if the statement can be shown to be true with the information provided. Otherwise, select No.
Attachment:
Tab.jpg [ 66.19 KiB | Viewed 7574 times ]
Archived Topic
Hi there,
This topic has been closed and archived due to inactivity or violation of community quality standards. No more replies are possible here.
Where to now? Join ongoing discussions on thousands of quality questions in our Graphs and Tables (G&T) Forum
Still interested in this question? Check out the "Best Topics" block below for a better discussion on this exact question, as well as several more related questions.
Thank you for understanding, and happy exploring!
| Yes | No | |
| The number of times the cardio rooms were accessed per member, on average, in Year 2 represented an increase from Year 1. | ||
| The ratio of cardio equipment available to total pieces of equipment available was greater in Year 6 than in any other year. | ||
| The ratio of strength equipment available to total equipment available in Year 3 was greater than the ratio of strength equipment room accesses to total room accesses in the same year. |
ShowHide Answer
Official Answer
The number of times the cardio rooms were accessed per member, on average, in Year 2 represented an increase from Year 1.: No
The ratio of cardio equipment available to total pieces of equipment available was greater in Year 6 than in any other year.: No
The ratio of strength equipment available to total equipment available in Year 3 was greater than the ratio of strength equipment room accesses to total room accesses in the same year.: Yes
 01 Jan 2020, 02:18
Kudos
Bookmarks
1)No, since the ratio in year 1 was 54.06 and in year 2 it was 53.21
2) No, since the difference in the values is higher so the ratio cannot be the highest
3)Yes,since the ratio of strength equipment available to total equipment available is 0.45 while the ratio ofstrength equipment room accesses to total room accesses is 0.38
Posted from my mobile device
2) No, since the difference in the values is higher so the ratio cannot be the highest
3)Yes,since the ratio of strength equipment available to total equipment available is 0.45 while the ratio ofstrength equipment room accesses to total room accesses is 0.38
Posted from my mobile device

 19 Dec 2020, 06:58
Kudos
Bookmarks
1)no, because there is a drop in cardio user and there is an increase in members
2)no from a quick look year five look highest
3)yes 110/243 is greater than 374../967..
2)no from a quick look year five look highest
3)yes 110/243 is greater than 374../967..