Graphics Interpretation one of types of questions that will appear on the new Integrated Reasoning section!
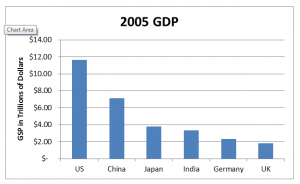
The following two graphs show economic data from 2005.
Graph #1
Graph #2
The real Integrated Reasoning Questions will have drop-down menus for the answer choices. For now, we are giving the equivalent form of standard multiple-choice, like ordinary GMAT Problem-Solving Questions.
1) The ratio of the US's 2005 GDP to Japan's 2005 GDP is closest to:
A) 1 to 4
B) 1 to 3
C) 3 to 4
D) 3 to 1
E) 4 to 1
2) India's 2005 GDP is what percent of China's 2005 GDP is closest to
A) 17%
B) 47%
C) 71%
D) 117%
E) 211%
3) In 2005, the US GDP surpassed China's GSP by approximately
A) $1.25 trillion
B) $3.00 trillion
C) $4.50 trillion
D) $7.50 trillion
E) $11.25 trillion
4) India's 2005 percent growth in GDP is approximately what percent of the US's percent growth in GDP?
A) 25%
B) 37%
C) 84%
D) 152%
E) 288%
Given that the percentage in the second chart is the percent by which last year's GDP increased to arrive at this year's GDP, find the approximate dollar amount by which China's GDP increase from 2004 to 2005.
A) $485 billion
B) $669 billion
C) $786 billion
D) $962 billion
E) $1.37 trillion
Practice Question Answers and Explanations
(1) D; (2) B; (3) C; (4) E; (5) B;
Notice, on these questions you are not expected to be able to read exact values off the graph. This is all about approximating, which is a vital skill not only on IR but also on the Quantitative Section in general.
1) Looking at the chart with the blue bars, the US's bar is slightly below $12 trillion, and Japan's bar is slightly below $4 billion – approximating to $12 billion and $4billion respectively, the ratio 12/4 = 3/1, or 3 to 1. Answer = D.
2) According to the phrasing, India is the part, and China is the whole. On the chart with the blue bars, China's part is close to $7 billion, and India's appears to be above $3 billion but is definitely below $4 billion. If we approximate India as $3.5 billion, then it's exactly half – that is, 50%. The only answer choice even vaguely close to 50% is 47%, answer = B.
3) Here, we are just being asked how much longer one bar is than another. On the blue chart, the US bar is slightly below $12 trillion, maybe $11.5 trillion. The China bar is close to $7 billion. Subtracting, 11.5 – 7 = 4.5, so the difference is approximately $4.5 trillion. Answer = C.
4) According to the phrasing, India is the part, and the US is the whole. On the graph with the green bars, we see that India actually has a higher rate of growth than does the US, so the percent will be greater than 100%. The US percent of growth is approximately 3%, and India's is close to 9%, almost three times bigger, so we expect a percentage that is close to 300%. The only one even close is 288%. Answer = E.
5) In 2005, China's GDP was approximately $7 trillion. According to the graph with the green bars, this was just over a 10% increase from the 2004 value. Call the 2004 value x. To get a 10% increase, we need to change the percent to a decimal and add one to get a multiplier – 0.10 is the decimal, and 1.1 is the multiplier. Thus, 7 = 1.1x. Using the onscreen calculator, we get 6.36 – so the 2004 value of China's GDP must have been around 6.36 trillion. The difference, 7 – 6.36 = .64, again, with help from the onscreen calculator. That's $0.64 trillion, or $640 billion. By far, the closest answer choice is $669 billion. Answer = B.
This post was written by Mike McGarry-- for more Math tips, check out GMAT Factors . Mike is a GMAT Expert at Magoosh GMAT Prep, which offers hundreds of GMAT Practice Questions with video explanation and lessons.


