Events & Promotions
|
|

GMAT Club Daily Prep
Thank you for using the timer - this advanced tool can estimate your performance and suggest more practice questions. We have subscribed you to Daily Prep Questions via email.
Customized
for You
Track
Your Progress
Practice
Pays
Not interested in getting valuable practice questions and articles delivered to your email? No problem, unsubscribe here.
 Sep 21
07:00 PM EDT
-10:00 PM EDT
Boost your GMAT score in less than one month in a live online class + 6 months access to TTP OnDemand video courses included! Sep 18
10:00 AM IST
-11:00 PM IST
Start your journey with a fully customized action plan and work with a dedicated mentor to achieve a 735+ score. Sep 26
01:00 PM EDT
-04:00 PM EDT
Top scores are possible when you enroll in a powerful GMAT course, taught live online + 6 months access to TTP OnDemand video courses included. Class starts Saturdays Sept. 26, 2026 - Dec. 19, 2026, 1:00pm-4:00pm ES


 27 Nov 2020, 07:42
Kudos
Bookmarks
Dropdown 1: 27
Dropdown 2: Biopower
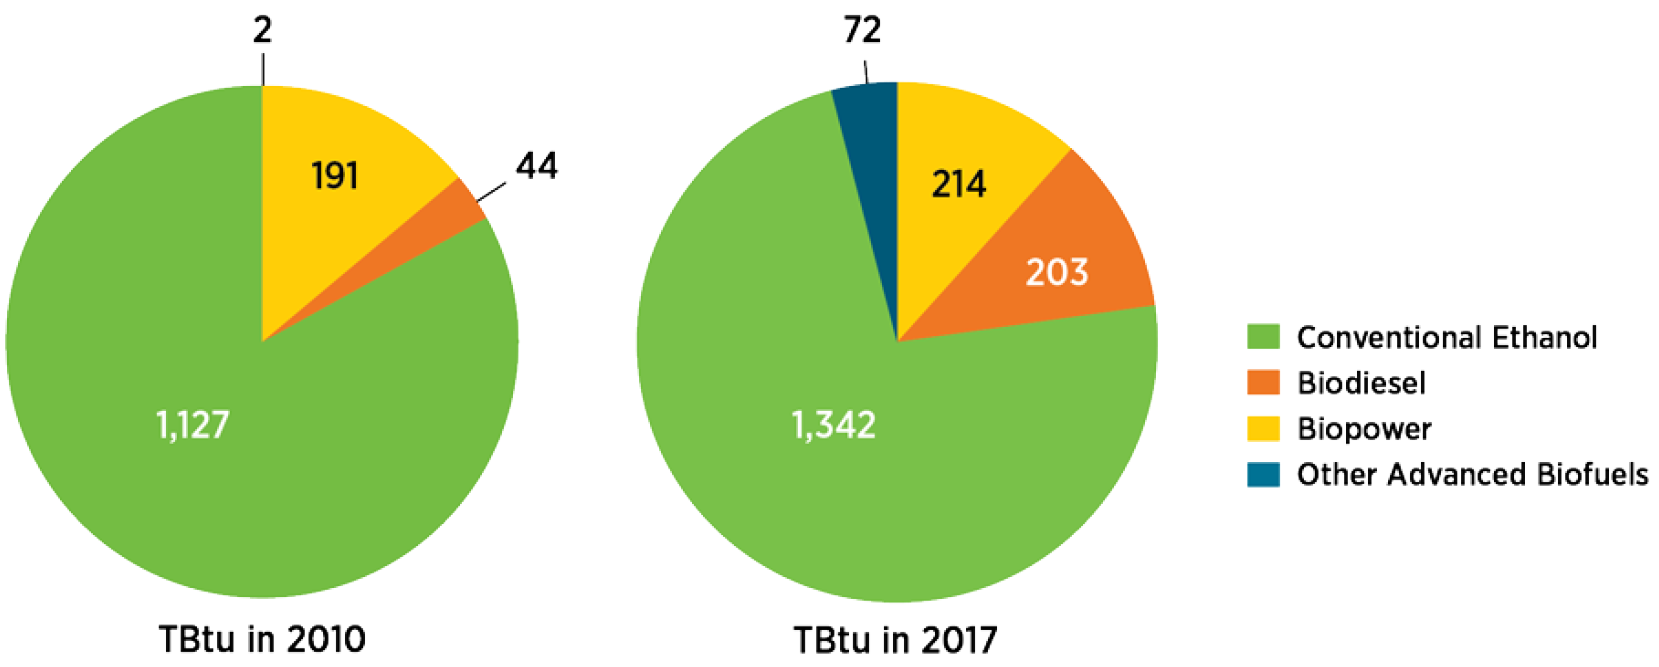
The charts display the production totals for various biofuel categories in the U.S. bioenergy market, measured in trillions of British thermal units. Total biofuel energy production was 1,364 trillion British thermal units in 2010 and increased to 1,831 trillion British thermal units in 2017.
Select from each drop-down menu the option that creates the most accurate statement, given the information provided.
The percentage of Other Advanced Biofuels production out of the total in 2017 was approximately times the percentage in 2010.
The smallest percentage increase in U.S. bioenergy production from 2010 to 2017 occurred for
ShowHide Answer
Official Answer
Dropdown 1: 27
Dropdown 2: Biopower
27 Nov 2020, 07:42
Kudos
Bookmarks
Official Solution:
Drop-down 1:
In 2017, Other Advanced Biofuels production accounted for (72/1,831) * 100% of the total production.
In 2010, Other Advanced Biofuels production accounted for (2/1,364) * 100% of the total production.
To determine how many times greater the 2017 percentage was compared to 2010, we calculate:
\(\frac{(\frac{72}{1,831})}{(\frac{2}{1,364})} =\frac{72}{1,831}*\frac{1,364}{2} =36*\frac{1,364}{1,831}\), which is approximately 27.
Drop-down 2:
Evaluating the charts, we identify two candidates for the smallest percentage increase: Conventional Ethanol and Biopower.
Conventional Ethanol increased by \(\frac{1,342 - 1,127}{1,127} * 100 \approx 19\%\).
Biopower increased by \(\frac{214 - 191}{191} * 100 \approx12\%\).
Since 12% is the smallest percentage increase, the least growth occurred for Biopower.
Correct answer:
Dropdown 1: "27"
Dropdown 2: "Biopower"
Bunuel
Drop-down 1:
In 2017, Other Advanced Biofuels production accounted for (72/1,831) * 100% of the total production.
In 2010, Other Advanced Biofuels production accounted for (2/1,364) * 100% of the total production.
To determine how many times greater the 2017 percentage was compared to 2010, we calculate:
\(\frac{(\frac{72}{1,831})}{(\frac{2}{1,364})} =\frac{72}{1,831}*\frac{1,364}{2} =36*\frac{1,364}{1,831}\), which is approximately 27.
Drop-down 2:
Evaluating the charts, we identify two candidates for the smallest percentage increase: Conventional Ethanol and Biopower.
Conventional Ethanol increased by \(\frac{1,342 - 1,127}{1,127} * 100 \approx 19\%\).
Biopower increased by \(\frac{214 - 191}{191} * 100 \approx12\%\).
Since 12% is the smallest percentage increase, the least growth occurred for Biopower.
Correct answer:
Dropdown 1: "27"
Dropdown 2: "Biopower"
30 Jan 2025, 05:26
Kudos
Bookmarks
I have revised the question, solution, and formatting by adding more details to enhance clarity