Events & Promotions
|
|

GMAT Club Daily Prep
Thank you for using the timer - this advanced tool can estimate your performance and suggest more practice questions. We have subscribed you to Daily Prep Questions via email.
Customized
for You
Track
Your Progress
Practice
Pays
Not interested in getting valuable practice questions and articles delivered to your email? No problem, unsubscribe here.
 Jun 04
08:30 AM PDT
-09:30 AM PDT
For most test takers, Data Insights is the most challenging section on the GMAT, with test takers scoring several points lower on average on DI than on Quant or Verbal and completing the section with less time to spare. May 29
10:00 AM IST
-11:00 PM IST
Start your journey with a fully customized action plan and work with a dedicated mentor to achieve a 735+ score.- Jun 03
08:30 AM PDT
-09:30 AM PDT
In Episode 7 of our GMAT Ninja CR series, we are rounding up the oddballs, the misfits, and the format-benders: EXCEPT, Fill-In-The-Blanks, and other unusual Critical Reasoning question types. When you see a question that ends with a literal blank line - Jun 10
06:00 AM PDT
-06:15 PM PDT
Register for the GMAT Club Virtual MBA Spotlight Fair – the world’s premier event for serious MBA candidates. This is your chance to hear directly from Admissions Directors at nearly every Top 30 MBA program..


Kudos
Bookmarks
Dropdown 1: ND
Dropdown 2: 5
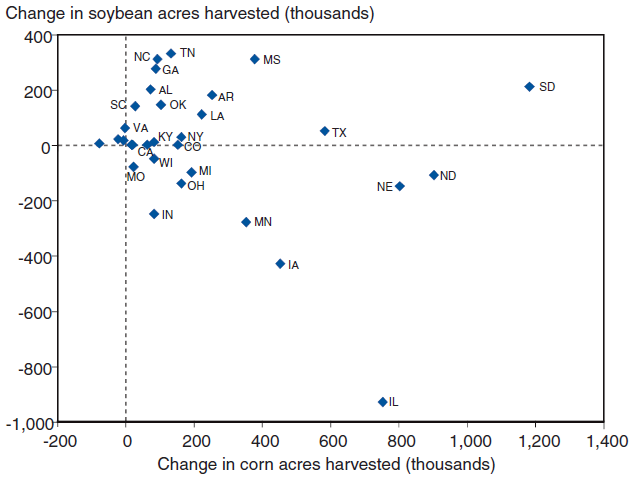
The graph shows state-level changes in corn and soybean acreage in the United States from January 2006 through December 2008.
Select from each drop-down menu the option that creates the most accurate statement based on the information provided.
The state that experienced the second largest increase in combined corn and soybean acreage during the period shown in the graph was .
The range of change in combined corn and soybean acreage among the states during the period shown in the graph was approximately times the largest increase in soybean acreage of any state during the same period.
ShowHide Answer
Official Answer
Dropdown 1: ND
Dropdown 2: 5
Kudos
Bookmarks
Official Solution:
Drop-down 1:
First, notice that the \(x\)-axis (corn acreage) ranges from -200 to 1,400, while the \(y\)-axis (soybean acreage) ranges from -1,000 to 400. Clearly, the state that experienced the largest increase in combined corn and soybean acreage was South Dakota (SD), with a total increase of approximately 1,200 + 200 = 1,400. The second largest increase appears to be in North Dakota (ND), with a net increase of approximately 900 + (-100) = 800.
Drop-down 2:
The range of change in combined corn and soybean acreage can be found by subtracting the largest decrease from the largest increase. The largest increase, as calculated above, was for South Dakota (SD) at 1,400. The largest decrease must be for Illinois (IL), at 750 + (-950) = -200. Thus, the range of change is 1,400 - (-200) = 1,600.
The largest increase in soybean acreage was for Tennessee (TN), at approximately 350.
Therefore, the range of 1,600 is approximately \(\frac{1,600}{350} \approx 5\) times the largest increase in soybean acreage of 350.
Correct answer:
Dropdown 1: "ND"
Dropdown 2: "5"
Bunuel
Drop-down 1:
First, notice that the \(x\)-axis (corn acreage) ranges from -200 to 1,400, while the \(y\)-axis (soybean acreage) ranges from -1,000 to 400. Clearly, the state that experienced the largest increase in combined corn and soybean acreage was South Dakota (SD), with a total increase of approximately 1,200 + 200 = 1,400. The second largest increase appears to be in North Dakota (ND), with a net increase of approximately 900 + (-100) = 800.
Drop-down 2:
The range of change in combined corn and soybean acreage can be found by subtracting the largest decrease from the largest increase. The largest increase, as calculated above, was for South Dakota (SD) at 1,400. The largest decrease must be for Illinois (IL), at 750 + (-950) = -200. Thus, the range of change is 1,400 - (-200) = 1,600.
The largest increase in soybean acreage was for Tennessee (TN), at approximately 350.
Therefore, the range of 1,600 is approximately \(\frac{1,600}{350} \approx 5\) times the largest increase in soybean acreage of 350.
Correct answer:
Dropdown 1: "ND"
Dropdown 2: "5"
Kudos
Bookmarks
I have revised the question, solution, and formatting by adding more details to enhance clarity