Events & Promotions
|
|

GMAT Club Daily Prep
Thank you for using the timer - this advanced tool can estimate your performance and suggest more practice questions. We have subscribed you to Daily Prep Questions via email.
Customized
for You
Track
Your Progress
Practice
Pays
Not interested in getting valuable practice questions and articles delivered to your email? No problem, unsubscribe here.
 Jun 08
08:00 PM EDT
-10:00 PM EDT
A powerful GMAT course taught live online + 6 months of access to TTP OnDemand GMAT Masterclass included! Mon/Wed June 8, 2026 →August 12, 2026 8:00pm-10:00pm EST Jun 10
06:00 AM PDT
-06:15 PM PDT
Register for the GMAT Club Virtual MBA Spotlight Fair – the world’s premier event for serious MBA candidates. This is your chance to hear directly from Admissions Directors at nearly every Top 30 MBA program.. Jun 11
11:00 AM EDT
-01:00 PM EDT
TTP GMAT OnDemand gives serious students 400+ hours of expert video instruction, the full TTP course, AI support, weekly office hours, and a 715+ score guarantee—all built for elite GMAT score improvement.


Kudos
Bookmarks
Dropdown 1: June and August
Dropdown 2: 25%
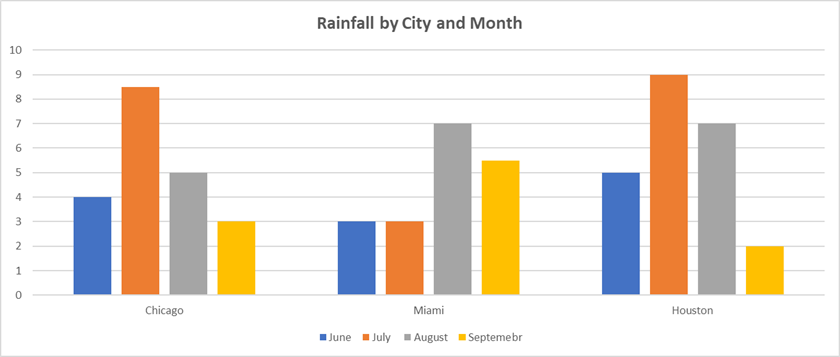
The bar chart shows the monthly rainfall, in inches, for three U.S. cities—Chicago, Miami, and Houston—from June through September.
From each drop-down menu, select the option that creates the most accurate statement based on the information provided.
The range of rainfall across the three cities was approximately the same for .
The highest average monthly rainfall across the four months for any city was approximately greater than the lowest average monthly rainfall for any city.
ShowHide Answer
Official Answer
Dropdown 1: June and August
Dropdown 2: 25%
Kudos
Bookmarks
Official Solution:
Drop-down 1:
The question asks you to find the two months in which the range of rainfall across the three cities is approximately the same. To do this, calculate the difference between the highest and lowest rainfall values for each month. Then identify the highest and lowest averages and compute how much greater the highest is than the lowest, as a percentage. So, we have:
June range: 5.0 (Houston) − 3.0 (Miami) = 2.0
July range: 9.0 (Houston) − 3.0 (Miami) = 6.0
August range: 7.0 (Miami) − 5.0 (Chicago) = 2.0
September range: 5.5 (Miami) − 2.0 (Houston) = 3.5
The ranges in June and August are both 2.0 inches.
Drop-down 2:
The question asks you to compare the average monthly rainfall across the four months for each city, and determine approximately how much greater the highest city average is than the lowest city average, expressed as a percentage. To solve this, first calculate the average rainfall for each city across all four months. Then, find the highest and lowest averages and compute the percent difference between them.
Chicago average: (4.0 + 8.5 + 5.0 + 3.0) / 4 = 20.5 / 4 ≈ 5.1
Miami average: (3.0 + 3.0 + 7.0 + 5.5) / 4 = 18.5 / 4 ≈ 4.6
Houston average: (5.0 + 9.0 + 7.0 + 2.0) / 4 = 23.0 / 4 ≈ 5.8
Highest average: ≈ 5.8 (Houston)
Lowest average: ≈ 4.6 (Miami)
Percent difference: 5.8/4.6 ≈ 1.26 ≈ 25%
Correct answer:
Dropdown 1: "June and August"
Dropdown 2: "25%"
Bunuel
Drop-down 1:
The question asks you to find the two months in which the range of rainfall across the three cities is approximately the same. To do this, calculate the difference between the highest and lowest rainfall values for each month. Then identify the highest and lowest averages and compute how much greater the highest is than the lowest, as a percentage. So, we have:
June range: 5.0 (Houston) − 3.0 (Miami) = 2.0
July range: 9.0 (Houston) − 3.0 (Miami) = 6.0
August range: 7.0 (Miami) − 5.0 (Chicago) = 2.0
September range: 5.5 (Miami) − 2.0 (Houston) = 3.5
The ranges in June and August are both 2.0 inches.
Drop-down 2:
The question asks you to compare the average monthly rainfall across the four months for each city, and determine approximately how much greater the highest city average is than the lowest city average, expressed as a percentage. To solve this, first calculate the average rainfall for each city across all four months. Then, find the highest and lowest averages and compute the percent difference between them.
Chicago average: (4.0 + 8.5 + 5.0 + 3.0) / 4 = 20.5 / 4 ≈ 5.1
Miami average: (3.0 + 3.0 + 7.0 + 5.5) / 4 = 18.5 / 4 ≈ 4.6
Houston average: (5.0 + 9.0 + 7.0 + 2.0) / 4 = 23.0 / 4 ≈ 5.8
Highest average: ≈ 5.8 (Houston)
Lowest average: ≈ 4.6 (Miami)
Percent difference: 5.8/4.6 ≈ 1.26 ≈ 25%
Correct answer:
Dropdown 1: "June and August"
Dropdown 2: "25%"