Events & Promotions
|
|

GMAT Club Daily Prep
Thank you for using the timer - this advanced tool can estimate your performance and suggest more practice questions. We have subscribed you to Daily Prep Questions via email.
Customized
for You
Track
Your Progress
Practice
Pays
Not interested in getting valuable practice questions and articles delivered to your email? No problem, unsubscribe here.
 Sep 18
01:30 AM EDT
-02:30 AM EDT
Learn how Kamakshi achieved a GMAT 675 with an impressive 96th %ile in Data Insights. Discover the unique methods and exam strategies that helped her excel in DI along with other sections for a balanced and high score. Sep 18
08:00 PM PDT
-09:00 PM PDT
Video explanations + diagnosis of 10 weakest areas + 150+ short videos + study plan! Sep 17
12:30 AM EDT
-01:30 AM EDT
Thought your job leaves no time for GMAT prep? After multiple GMAT attempts and a demanding consulting job, Kshitij improved to 695 in under 2 months. Learn the mindset shifts, study strategy, and execution changes that made the breakthrough possible. Sep 19
02:30 AM EDT
-03:30 AM EDT
Tejas studied hard but kept repeating the same mistakes. After 3 attempts at 645, a focused 4-week strategy helped him identify and fix what was holding him back—leading to a 695 with just 12–15 hours of study per week. Sep 26
01:00 PM EDT
-04:00 PM EDT
Top scores are possible when you enroll in a powerful GMAT course, taught live online + 6 months access to TTP OnDemand video courses included. Class starts Saturdays Sept. 26, 2026 - Dec. 19, 2026, 1:00pm-4:00pm ES Sep 29
11:00 AM EDT
-01:00 PM EDT
" Description: Top scores are possible when you enroll in a powerful GMAT course, taught live online + 6 months access to TTP OnDemand video courses included! Class starts Tues/Thur Sept. 29, 2026 - Dec. 3, 2026, 11:00am-1:00pm EST


Dropdown 1: ND
Dropdown 2: 5
Be sure to select an answer first to save it in the Error Log before revealing the correct answer (OA)!
Difficulty:
 95%
(hard)
95%
(hard)
Question Stats:
29% (02:56) correct 71%
(03:13)
wrong
based on 372
sessions
71%
(03:13)
wrong
based on 372
sessions
History
Date
Time
Result
Not Attempted Yet
The graph shows state-level changes in corn and soybean acreage in the United States from January 2006 through December 2008.
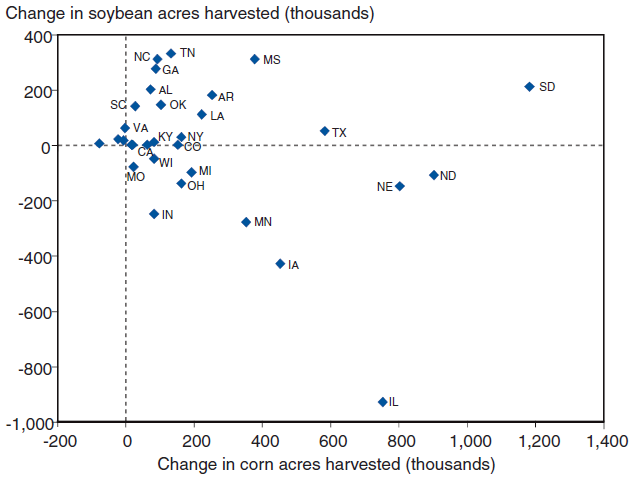
Select from each drop-down menu the option that creates the most accurate statement based on the information provided.
The state that experienced the second largest increase in combined corn and soybean acreage during the period shown in the graph was .
The range of change in combined corn and soybean acreage among the states during the period shown in the graph was approximately times the largest increase in soybean acreage of any state during the same period.

4.jpg [ 61.72 KiB | Viewed 8785 times ]
Select from each drop-down menu the option that creates the most accurate statement based on the information provided.
The state that experienced the second largest increase in combined corn and soybean acreage during the period shown in the graph was .
The range of change in combined corn and soybean acreage among the states during the period shown in the graph was approximately times the largest increase in soybean acreage of any state during the same period.
Attachment:
4.jpg [ 61.72 KiB | Viewed 8785 times ]
ShowHide Answer
Official Answer
Dropdown 1: ND
Dropdown 2: 5
 18 Nov 2024, 05:50
Kudos
Bookmarks
Bunuel

Official Solution:
Drop-down 1:
First, notice that the \(x\)-axis (corn acreage) ranges from -200 to 1,400, while the \(y\)-axis (soybean acreage) ranges from -1,000 to 4,000. Clearly, the state that experienced the largest increase in combined corn and soybean acreage was South Dakota (SD), with a total increase of approximately 1,200 + 200 = 1,400. The second largest increase appears to be in North Dakota (ND), with a net increase of approximately 900 + (-100) = 800.
Drop-down 2:
The range of change in combined corn and soybean acreage can be found by subtracting the largest decrease from the largest increase. The largest increase, as calculated above, was for South Dakota (SD) at 1,400. The largest decrease must be for Illinois (IL), at 750 + (-950) = -200. Thus, the range of change is 1,400 - (-200) = 1,600.
The largest increase in soybean acreage was for Tennessee (TN), at approximately 350.
Therefore, the range of 1,600 is approximately \(\frac{1,600}{350} \approx 5\) times the largest increase in soybean acreage of 350.
Correct answer:
Dropdown 1: "ND"
Dropdown 2: "5"
 21 Jan 2026, 04:12
Kudos
Bookmarks
Automated notice from GMAT Club BumpBot:
A member just gave Kudos to this thread, showing it’s still useful. I’ve bumped it to the top so more people can benefit. Feel free to add your own questions or solutions.
This post was generated automatically.
A member just gave Kudos to this thread, showing it’s still useful. I’ve bumped it to the top so more people can benefit. Feel free to add your own questions or solutions.
This post was generated automatically.