Events & Promotions
|
|

GMAT Club Daily Prep
Thank you for using the timer - this advanced tool can estimate your performance and suggest more practice questions. We have subscribed you to Daily Prep Questions via email.
Customized
for You
Track
Your Progress
Practice
Pays
Not interested in getting valuable practice questions and articles delivered to your email? No problem, unsubscribe here.
- Nov 20
07:30 AM PST
-08:30 AM PST
Learn what truly sets the UC Riverside MBA apart and how it helps in your professional growth - Nov 22
11:00 AM IST
-01:00 PM IST
Do RC/MSR passages scare you? e-GMAT is conducting a masterclass to help you learn – Learn effective reading strategies Tackle difficult RC & MSR with confidence Excel in timed test environment - Nov 23
11:00 AM IST
-01:00 PM IST
Attend this free GMAT Algebra Webinar and learn how to master the most challenging Inequalities and Absolute Value problems with ease. - Nov 25
10:00 AM EST
-11:00 AM EST
Prefer video-based learning? The Target Test Prep OnDemand course is a one-of-a-kind video masterclass featuring 400 hours of lecture-style teaching by Scott Woodbury-Stewart, founder of Target Test Prep and one of the most accomplished GMAT instructors.
Originally posted by Sajjad1994 on 15 Jul 2021, 20:30.
Last edited by BottomJee on 10 Nov 2023, 09:37, edited 3 times in total.
Last edited by BottomJee on 10 Nov 2023, 09:37, edited 3 times in total.
Moved to new forum
Kudos
Bookmarks
Dropdown 1: 100 to 55
Dropdown 2: Five percentage points less than
Be sure to select an answer first to save it in the Error Log before revealing the correct answer (OA)!
Difficulty:
 65%
(hard)
Question Stats:
59% (02:24) correct 41%
(02:19)
wrong
  based on 978
sessions
History
Date
Time
Result
Not Attempted Yet
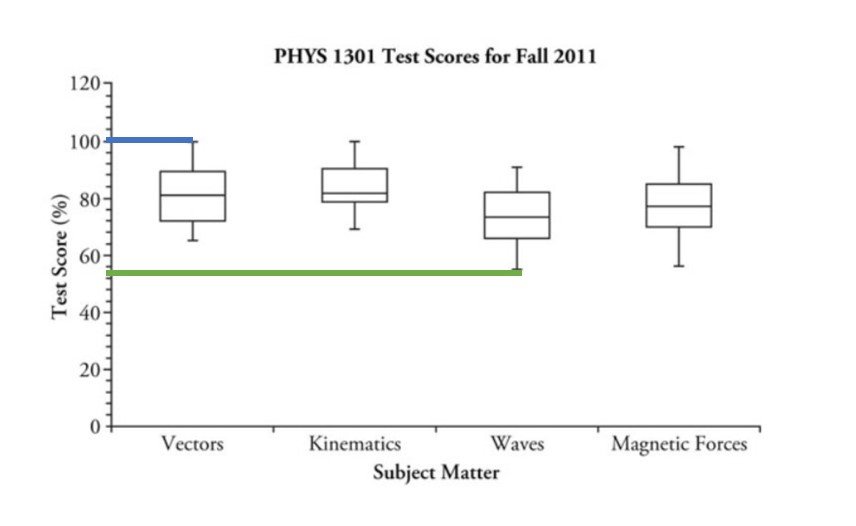
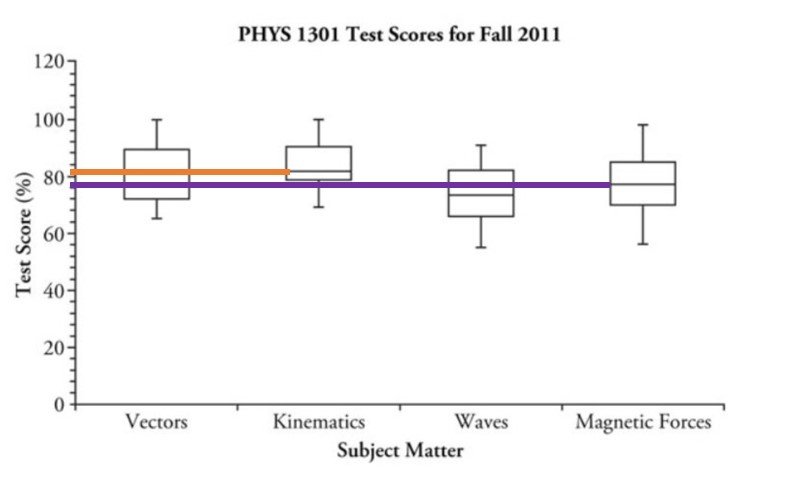
The graph above is a box plot with four measurements, each representing the scores of 20 students, measured over the Fall 2011 semester of PHYS 1301. Each box represents the middle 50%, also known as the interquartile range, and the lines extending vertically upwards or downwards represent the top 25% and bottom 25%, respectively. The solid line inside the box represents the median test score for each measurement.
Use the drop-down menus to fill in the blanks in each of the following statements based on the information given by the graph.
1. Test scores range from between the Vector Test and the Waves Test.
2. The median score for the Magnetic Forces test is approximately the median score for the Kinematics test.
Attachment:
3.jpg [ 34.86 KiB | Viewed 8037 times ]
ShowHide Answer
Official Answer
Dropdown 1: 100 to 55
Dropdown 2: Five percentage points less than
Kudos
Bookmarks
Test scores range from___________between the Vector Test and the Waves Test.
Highest Score for Vectors (Indicated with Blue line in the image below) = 100
Lowest Score for Wave (Indicated with Green line in the image below) = 55
So, Range is 100 to 55
So, Answer will be A

image1-1.jpg [ 29.8 KiB | Viewed 7171 times ]
The median score for the Magnetic Forces test is approximately_____________the median score for the Kinematics test.
Median score is the middle line in the box.
Median score for Kinematics (Indicated with Orange line in the image below) ~ 82
Median score for Magnetic Forces (Indicated with Purple line in the image below) ~ 77

image1-2.jpg [ 29.56 KiB | Viewed 7008 times ]
So, The median score for the Magnetic Forces test is approximately Five percentage points less than the median score for the Kinematics test.
So, answer will be D
Hope it helps!
Watch the following video to learn the Basics of Box and Whisker Plot
Highest Score for Vectors (Indicated with Blue line in the image below) = 100
Lowest Score for Wave (Indicated with Green line in the image below) = 55
So, Range is 100 to 55
So, Answer will be A
Attachment:
image1-1.jpg [ 29.8 KiB | Viewed 7171 times ]
The median score for the Magnetic Forces test is approximately_____________the median score for the Kinematics test.
Median score is the middle line in the box.
Median score for Kinematics (Indicated with Orange line in the image below) ~ 82
Median score for Magnetic Forces (Indicated with Purple line in the image below) ~ 77
Attachment:
image1-2.jpg [ 29.56 KiB | Viewed 7008 times ]
So, The median score for the Magnetic Forces test is approximately Five percentage points less than the median score for the Kinematics test.
So, answer will be D
Hope it helps!
Watch the following video to learn the Basics of Box and Whisker Plot
General Discussion
Kudos
Bookmarks
The graph is difficult to read. The option choices being closer ones, would have helped if there were some support lines to help trace values.


