Events & Promotions
|
|

GMAT Club Daily Prep
Thank you for using the timer - this advanced tool can estimate your performance and suggest more practice questions. We have subscribed you to Daily Prep Questions via email.
Customized
for You
Track
Your Progress
Practice
Pays
Not interested in getting valuable practice questions and articles delivered to your email? No problem, unsubscribe here.
 Jun 08
03:00 PM PDT
-04:00 PM PDT
15 Full-length GMAT FE mocks with insightful analytics, weakness diagnosis, and video explanations! Jun 08
08:00 PM EDT
-10:00 PM EDT
Master the GMAT with expert live instruction, a personalized study plan, and real-time support. Includes 40 hours of online classes plus 6 months of access to the TTP GMAT OnDemand video course. Mon/Wed June 8, 2026 →August 12, 2026 8:00pm-10:00pm EST Jun 10
06:00 AM PDT
-06:15 PM PDT
Register for the GMAT Club Virtual MBA Spotlight Fair – the world’s premier event for serious MBA candidates. This is your chance to hear directly from Admissions Directors at nearly every Top 30 MBA program..- Jun 10
10:00 AM PDT
-11:00 AM PDT
Scoring 715 on the GMAT Focus Edition requires more than just learning formulas, memorizing concepts, or solving hundreds of questions. In this episode, Nishant shares how he improved his GMAT preparation by focusing on application of concepts, and more.  Jun 11
11:00 AM EDT
-01:00 PM EDT
TTP GMAT OnDemand gives serious students 400+ hours of expert video instruction, the full TTP course, AI support, weekly office hours, and a 715+ score guarantee—all built for elite GMAT score improvement.


Kudos
Bookmarks
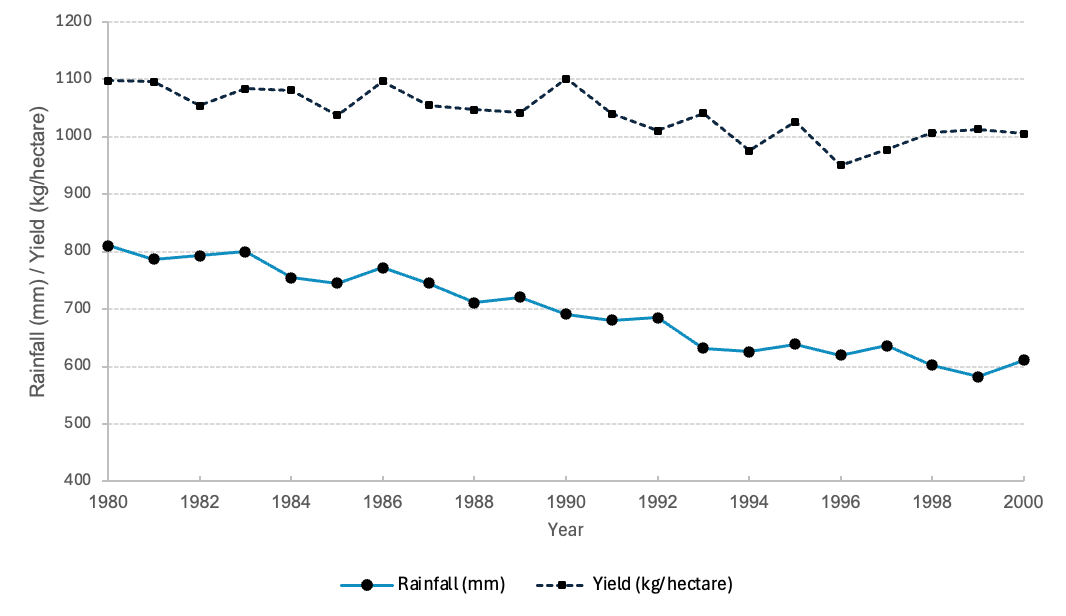
In 2000, the Agronomy Research Lab at Andes Valley University initiated a decade-long study to enhance the productivity of quinoa, a crop indigenous to South America known for its resilience and high nutritional value. The study was motivated by analysis of historical data from 1980 to 2000, which showed a consistent decline in annual rainfall across the region and a corresponding reduction in quinoa yield per hectare.

Fertilizer + Pesticide C
Be sure to select an answer first to save it in the Error Log before revealing the correct answer (OA)!
Difficulty:
 15%
(low)
15%
(low)
Question Stats:
72% (02:46) correct 28%
(02:38)
wrong
based on 358
sessions
28%
(02:38)
wrong
based on 358
sessions
History
Date
Time
Result
Not Attempted Yet
Between 2001 and 2010, which of the following experiments saw the greatest percentage increase in yield?
| Pesticide A | |
| Pesticide B | |
| Pesticide C | |
| Fertilizer + Pesticide A | |
| Fertilizer + Pesticide C |
ShowHide Answer
Official Answer
Fertilizer + Pesticide C
Pesticide A + Fertilizer: No
Pesticide B + Fertilizer: No
Pesticide C + Fertilizer: Yes
Be sure to select an answer first to save it in the Error Log before revealing the correct answer (OA)!
Difficulty:
 45%
(medium)
45%
(medium)
Question Stats:
65% (01:51) correct
35%
(02:04)
wrong
based on 365
sessions
History
Date
Time
Result
Not Attempted Yet
For each pair below, determine whether the fertilizer + pesticide combination resulted in a larger total increase in yield from 2000 to 2003 than the corresponding pesticide used alone.
To calculate the yield increase, use the difference between the starting and ending yield of each treatment as shown in its respective graph.
Select “Yes” if the fertilizer + pesticide combination produced a larger yield gain during that period.
Select “No” if the pesticide-alone treatment had equal or greater yield gain.
| Yes | No | |
| Pesticide A + Fertilizer | ||
| Pesticide B + Fertilizer | ||
| Pesticide C + Fertilizer |
ShowHide Answer
Official Answer
Pesticide A + Fertilizer: No
Pesticide B + Fertilizer: No
Pesticide C + Fertilizer: Yes
+20%
Be sure to select an answer first to save it in the Error Log before revealing the correct answer (OA)!
Difficulty:
 75%
(hard)
75%
(hard)
Question Stats:
54% (02:12) correct
46%
(02:17)
wrong
based on 379
sessions
History
Date
Time
Result
Not Attempted Yet
In agricultural policy, water productivity is defined as: Water Productivity = Yield (kg/hectare) ÷ Rainfall (mm).
Which of the following is closest to the percentage change in water productivity from 1980 to 2000?
Which of the following is closest to the percentage change in water productivity from 1980 to 2000?
| +10% | |
| +15% | |
| +20% | |
| -20% | |
| -25% |
Attachment:
GMAT-Club-Forum-7xdpa8ba.png [ 39.5 KiB | Viewed 2851 times ]
Attachment:
GMAT-Club-Forum-d08xfm8f.png [ 27.43 KiB | Viewed 2706 times ]
Attachment:
GMAT-Club-Forum-vkytggfw.png [ 30.63 KiB | Viewed 2703 times ]

Kudos
Bookmarks
Quote:
Why is pesticide A + fertilizer answer as no ? From the graph, the line seems to be above whatever we have for the counterpart only pesticide ?


Kudos
Bookmarks
Are you looking at the right time frame from the graph? The question asks for the results from 2000 to 2003 only.
Saksham23


