Events & Promotions
| Last visit was: 06 Sep 2026, 10:40 |
It is currently 06 Sep 2026, 10:40 |
|
|

GMAT Club Daily Prep
Thank you for using the timer - this advanced tool can estimate your performance and suggest more practice questions. We have subscribed you to Daily Prep Questions via email.
Customized
for You
Track
Your Progress
Practice
Pays
Not interested in getting valuable practice questions and articles delivered to your email? No problem, unsubscribe here.
 Sep 07
12:01 AM PDT
-11:59 PM PDT
On the 7th, GMAT Club Tests will be Free! Including all the Quizzes, Questions, and Tests. 12 AM - 11:59 PM PDT- Sep 08
11:00 AM PDT
-12:00 PM PDT
Strong applicants do not always write strong MBA essays. In this session, we break down 5 common MBA essay mistakes that can quietly weaken an otherwise competitive application. - Sep 09
07:00 AM PDT
-10:00 AM PDT
Meet AdComs and explore top Master’s programs - MiM, MiF, MSc, MSBA and more. - Application Fee Waivers - Free 1-Week of GMAT Club Tests: - Master's Application Toolkit - Grand Prize Giveaway  Sep 09
09:00 AM PDT
-10:00 AM PDT
Join the chat on Wednesday - What’s in it for you? - Live Profile Evaluation Chat Session with Jenifer Turtschanow, CEO, ARINGO.- Sep 09
10:00 AM PDT
-11:00 AM PDT
Three MBA applications. Three rejections. No interview invites. A year later, Aman was admitted to Cambridge Judge, SMU, and IMD. In this episode of MBA Admit Stories, Aman shares how he rebuilt his MBA application...  Sep 09
12:00 PM PDT
-01:00 PM PDT
The old MBA recruiting playbook is dead. Here’s how top admits are getting ahead this summer.- Sep 10
11:00 AM PDT
-12:00 PM PDT
What does a truly strong MBA application resume actually look like? In this session, we break down 3 real MBA resumes from successful applicants who got into top business schools. Using redacted before-and-after versions...  Sep 10
12:00 PM IST
-01:00 PM IST
Before you hit “Submit,” get an expert perspective on your MBA application. Our Test Drive Service (Comprehensive Application Review) provides an in-depth evaluation of your application, helping you identify gaps, strengthen your story, and more. Sep 10
03:00 PM PDT
-04:00 PM PDT
Inquire for a free profile evaluation and guarantee statement for possible admits and scholarships! Sep 11
08:30 AM EDT
-09:15 AM EDT
Get the inside scoop on what makes Emory’s Goizueta Business School great, learn how you can present a strong MBA application, and connect with an Admissions Director to get your questions answered.- Sep 16
12:00 PM PDT
-01:00 PM PDT
Grab your favorite beverage and spend time chatting with Melissa Rapp, Associate Dean of Graduate Admissions, and Brian Mitchell, Associate Dean of the Full-Time MBA Program. The topic for this Coffee Chat is Entrepreneurship and Innovation.


 09 Feb 2017, 05:02
Kudos
Bookmarks
Harvard vs Stanford
Harvard and Stanford are the two best business schools in the world. Both of them are known for producing some of the world’s foremost business leaders and innovators. Harvard is credited with the development of its famed case study method whereas Stanford, most selective business school in the US, is well known for its focus on innovation and entrepreneurship and its tight-knit, collaborative culture.
So how do you decide which program is best for you? To help prospective applicants as well as those who have already been admitted and deciding which one to choose, we decided to compare these MBA programs side-by-side and analyze the differences between them
We compared class profiles, curriculum, strengths and weaknesses, rankings, and placements of these two. Below is the detailed comparison of these schools taking all factors one by one. Article ends with main conclusion and winner of this competition.
Stanford GSB is in the heart of Silicon Valley, a short drive away from the most important VCs and tech startups/companies in the world, and HBS is in Boston, one of the most dynamic and inviting cities, known as the Athens of America.
Program Length: 2 years
Curriculum: Harvard is known for its case study method, which was pioneered and perfected by the HBS faculty. The case method places students in the role of decision-maker and requires them to confront real issues. It is incredibly helpful in facilitating the transition from Junior level positions to Management as it helps students think about the problem as a whole and not focus on specific aspects of the theory being thaught, writes a current first year student. FIELD - Field Immersion Experiences for Leadership Development - is another highlight of HBS MBA experience, which, HBS says, complements case-method learning with smaller hands-on team projects, personal reflection, and global immersions.
Required Courses (1st year): In the first year all students follow the same core curriculum comprised of 6 required courses, including FIELD foundation and global immersion, in term1 and term2 each. Students are divided into the groups of 90 students and take every single class together in the same classroom.
Electives (2nd year): You can choose from nearly 120 elective courses. Students can take up to 5 elective courses per semester. Students can also cross-register for certain programs offered by MIT Sloan and Fletcher School of Law and Diplomacy. Complete list of electives is available here https://www.hbs.edu/coursecatalog/
Interdisciplinary Programs: 5 joint degree programs are available at HBS to prepare students for complex leadership challenges that balance expertise with effective management skills.
1) MBA/MPP (Master of Public Policy) in collaboration with Harvard Kennedy School https://www.hbs.edu/mba/academic-experie ... chool.aspx
2) MBA/MPA-ID (Master of Public Administration-International Development) in collaboration with Harvard Kennedy School https://www.hbs.edu/mba/academic-experie ... chool.aspx
3) JD/MBA in collaboration with Harvard Law School https://www.hbs.edu/mba/academic-experie ... chool.aspx
4) MD/MBA in collaboration with Harvard Medical School https://www.hbs.edu/mba/academic-experie ... chool.aspx
5) DMD/MBA in collaboration with Harvard School of Dental Medicine https://www.hbs.edu/mba/academic-experie ... icine.aspx
Program Length: 2 years
Curriculum: GSB has a more customizable curriculum. In the first year, students develop their general management knowledge and gain global experience.
GSB also requires students to participate in a global experience. This can be in the form of a four-week overseas project during the summer working with a partner firm, a trip with classmates to discuss major issues with business leaders, a similar trip with classmates focused on social innovation and coupled with a short project, or participation in a short exchange program (STEP) with Tsinghua University in China.
Electives: During your second year you can build your own curriculum of electives as you see fit. Students may take up to 18 electives, as well as compressed courses – a series of two-week courses to build deep knowledge in specific business topics. More info can be found here.. https://www.gsb.stanford.edu/programs/m ... curriculum
Interdisciplinary Programs: More than 20% of Stanford MBA students take a joint or dual degree to complement their MBA. Around 6 joint degree and 2 dual degree options are available at Stanford. Students can also take degree programs at schools outside of Stanford University. Complete list of available joint/dual degree options is here.. https://www.gsb.stanford.edu/programs/m ... al-degrees
It's really difficult to choose from HBS and GSB. In terms of prestige, they both have strong reputation. In both schools you will be surrounded by really excellent, interesting people.
In academics, according to our member students, HBS is slightly more intense than GSB. If you like case based learning you should consider HBS, but if you are looking for a flexible curriculum and mix of various teaching methods, you should go for Stanford.
In terms of placements, both schools will provide you world of opportunities. Whether you want to go in to PE and start your own venture, you will have your chance at either school, and the Stanford brand and connections will help you as much as Harvard. So it is not about the best school but the school that is best for you.
Harvard: 5 Stanford: 5
It's a Tie
-

HBSGSB Ranking.png [ 20.11 KiB | Viewed 11273 times ]
Harvard and Stanford are the two best business schools in the world. Both of them are known for producing some of the world’s foremost business leaders and innovators. Harvard is credited with the development of its famed case study method whereas Stanford, most selective business school in the US, is well known for its focus on innovation and entrepreneurship and its tight-knit, collaborative culture.
So how do you decide which program is best for you? To help prospective applicants as well as those who have already been admitted and deciding which one to choose, we decided to compare these MBA programs side-by-side and analyze the differences between them
We compared class profiles, curriculum, strengths and weaknesses, rankings, and placements of these two. Below is the detailed comparison of these schools taking all factors one by one. Article ends with main conclusion and winner of this competition.
Class Profile
- Among all top US schools, Stanford has lowest acceptance rate. Last year Stanford received 8116 applications and roughly 6% of these applicants got admission call from GSB. On the other hand, Harvard's acceptance rate was 11%
- Although GSB takes over HBS in acceptance rate, yield rate of latter is slightly higher than GSB and this is very valuable input to measure the percentage of admitted students who actually go to a school rather than turn it down. This is contrary to findings of the survey of 63 HBS-GSB dual admits conducted by Businessweek in 2015 in which 56% of the admits said they are going to turn down HBS's offer and choose GSB, whereas only 22% chose HBS over GSB.
- Proportion of international students at HBS is lower by 5 percentage points than that of GSB, but HBS has representation of 68 countries whereas GSB has 62 countries.
- Students who did their undergraduate work in humanities represent 48% of the Class of 2018 at Stanford, versus 21% at Harvard. On the other hand, Harvard is much more open to enrolling business/economics undergrads than Stanford.
- GSB has a smaller full-time student body (around 400 students) than HBS (950), which helps maintain high interaction levels between students and their peers and professors.
- Based on these inputs we can say HBS is preferred choice for Business/Economics undergrads whereas GSB is preferred by those who did their undergraduate work in the humanities/social sciences.
| HBS vs GSB: Class Profile | ||
| Harvard | Stanford | |
| Length of Program | 2 Years | 2 Years |
| # of Applicants | 9759 | 8116 |
| Admitted | 1038 | 474 |
| Enrolled | 934 | 417 |
| Yield | 90% | 88% |
| Avg GMAT | 730 (Middle 80%: 690 - 760) | 737 (Range: 590 - 790) |
| Avg GPA | 3.67 | 3.73 |
| Avg Age | 27 | N/A |
| Avg WE (Months) | N/A | 48 |
| Female Students | 43% | 41% |
| International Students | 35% | 40% |
| Countries Represented | 68 | 62 |
| Most Common Educational Background | Business/Economics (41%) | Humanities//Social Sciences (48%) |
| HBS vs GSB: Feeder Industries | ||
| Harvard | Stanford | |
| Consulting | 15% | 18% |
| Banking and Finance | 26% | 27% |
| Retail and Consumer Products | 7% | 7% |
| Edu, Govt, Military, & Non Profit | 7% | 9% |
| Technology/E-Commerce/Internet | 15% | 16% |
| Media, Entertainment, and Sports | N/A | 6% |
| Real Estate | N/A | N/A |
| Telecom | Included in Technology | N/A |
| Energy & Utilities | 7% | 6% |
| Healthcare & Biotech | 7% | 5% |
| Manufacturing | 5% | 2% |
| Other | 11% | 4% |
Location
Stanford GSB is in the heart of Silicon Valley, a short drive away from the most important VCs and tech startups/companies in the world, and HBS is in Boston, one of the most dynamic and inviting cities, known as the Athens of America.
Academics
Harvard
Program Length: 2 years
Curriculum: Harvard is known for its case study method, which was pioneered and perfected by the HBS faculty. The case method places students in the role of decision-maker and requires them to confront real issues. It is incredibly helpful in facilitating the transition from Junior level positions to Management as it helps students think about the problem as a whole and not focus on specific aspects of the theory being thaught, writes a current first year student. FIELD - Field Immersion Experiences for Leadership Development - is another highlight of HBS MBA experience, which, HBS says, complements case-method learning with smaller hands-on team projects, personal reflection, and global immersions.
Required Courses (1st year): In the first year all students follow the same core curriculum comprised of 6 required courses, including FIELD foundation and global immersion, in term1 and term2 each. Students are divided into the groups of 90 students and take every single class together in the same classroom.
Electives (2nd year): You can choose from nearly 120 elective courses. Students can take up to 5 elective courses per semester. Students can also cross-register for certain programs offered by MIT Sloan and Fletcher School of Law and Diplomacy. Complete list of electives is available here https://www.hbs.edu/coursecatalog/
Interdisciplinary Programs: 5 joint degree programs are available at HBS to prepare students for complex leadership challenges that balance expertise with effective management skills.
1) MBA/MPP (Master of Public Policy) in collaboration with Harvard Kennedy School https://www.hbs.edu/mba/academic-experie ... chool.aspx
2) MBA/MPA-ID (Master of Public Administration-International Development) in collaboration with Harvard Kennedy School https://www.hbs.edu/mba/academic-experie ... chool.aspx
3) JD/MBA in collaboration with Harvard Law School https://www.hbs.edu/mba/academic-experie ... chool.aspx
4) MD/MBA in collaboration with Harvard Medical School https://www.hbs.edu/mba/academic-experie ... chool.aspx
5) DMD/MBA in collaboration with Harvard School of Dental Medicine https://www.hbs.edu/mba/academic-experie ... icine.aspx
Stanford
Program Length: 2 years
Curriculum: GSB has a more customizable curriculum. In the first year, students develop their general management knowledge and gain global experience.
GSB also requires students to participate in a global experience. This can be in the form of a four-week overseas project during the summer working with a partner firm, a trip with classmates to discuss major issues with business leaders, a similar trip with classmates focused on social innovation and coupled with a short project, or participation in a short exchange program (STEP) with Tsinghua University in China.
Electives: During your second year you can build your own curriculum of electives as you see fit. Students may take up to 18 electives, as well as compressed courses – a series of two-week courses to build deep knowledge in specific business topics. More info can be found here.. https://www.gsb.stanford.edu/programs/m ... curriculum
Interdisciplinary Programs: More than 20% of Stanford MBA students take a joint or dual degree to complement their MBA. Around 6 joint degree and 2 dual degree options are available at Stanford. Students can also take degree programs at schools outside of Stanford University. Complete list of available joint/dual degree options is here.. https://www.gsb.stanford.edu/programs/m ... al-degrees
Rankings
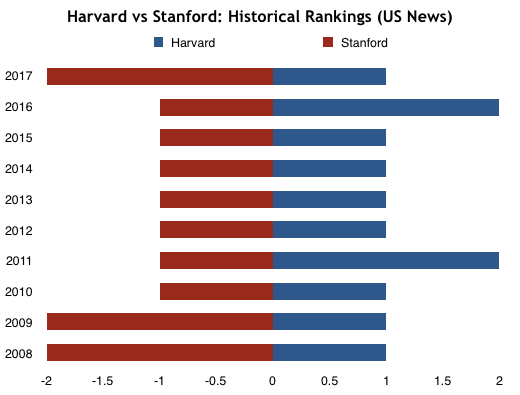
- A tricky situation to deal with, mostly because they both are most prestigious business schools in the world. In last 10 years, HBS has topped US News rankings 8 times whereas Stanford was on top 7 times.
- In current scenario, HBS has surpassed GSB in US News, Economist, and BW rankings where as GSB is ahead of HBS in Forbes and FT rankings.
- So a clear tie between HBS and GSB in this area of comparison considering historical as well as current rankings.
| HBS vs GSB: Current Rankings | ||
| Harvard | Stanford | |
| US News 17 | 1 | 2 |
| Economist 16 | 4 | 5 |
| BusinessWeek 16 | 1 | 2 |
| Forbes 15 | 2 | 1 |
| Financial Times 17 | 4 | 2 |
Placements
- Placement stats below show that HBS and GSB are leaders in the world of the business education. The difference in average salaries of these schools is largely nominal, though It seems HBS graduates are slightly quicker off the mark; 94% find employment within three months, while the equivalent figure for Stanford is 74%.
- In 2016, 28% of HBS graduates went into finance (down from 31% the previous year), 25% into consulting (up from 24%), and 19% went into technology (down from 20%).
- At GSB, the Class of 2016 chose careers in a wide variety of industries—finance and technology being at the top at 31% and 33% (up from 28% the previous year), respectively. Consulting increased to 16% (up from 14% the previous year)
- At GSB, 15% of the Class of 2016 decided to go into entrepreneurship whereas 7% of HBS graduates decided to start a new business. This makes us believe that GSB is more likely to inspire its students to become entrepreneurs.
- HBS is perceived to have a broader placement reach, not just within the US but also outside. 43% of the HBS students employed in Northeast, 43% at other US locations, and 14% outside the US. On the other hand 65% of the GSB students employed in West, 25% at other US locations, and 10% outside the US. The international job market seems to have a slight preference for HBS over GSB.
- Considering its slightly higher acceptance rate and broader placement reach, we can say HBS has slight advantage over GSB in placements.
| HBS vs GSB: Placements | ||
| Harvard | Stanford | |
| Placement Rate | 94% | 90% |
| Median Base Salary | $135,000 | $136,000 |
| Placements by Industry | ||
| Consulting | 25% | 16% |
| Banking and Finance | 28% | 31% |
| Technology | 19% | 33% |
| Retail and Consumer Products | 5% | 2% |
| Entertainment and Sports | 3% | 3% |
| Healcare/Pharma/Biotech | 8% | 6% |
| Manufacturing | 5% | N/A |
| Edu/Non-Profit/Govt | 2% | N/A |
| Energy and Utilities | N/A | 3% |
| Other | 5% | 6% |
So who is the winner??
It's really difficult to choose from HBS and GSB. In terms of prestige, they both have strong reputation. In both schools you will be surrounded by really excellent, interesting people.
In academics, according to our member students, HBS is slightly more intense than GSB. If you like case based learning you should consider HBS, but if you are looking for a flexible curriculum and mix of various teaching methods, you should go for Stanford.
In terms of placements, both schools will provide you world of opportunities. Whether you want to go in to PE and start your own venture, you will have your chance at either school, and the Stanford brand and connections will help you as much as Harvard. So it is not about the best school but the school that is best for you.
Harvard: 5 Stanford: 5
It's a Tie
-
Attachment:
HBSGSB Ranking.png [ 20.11 KiB | Viewed 11273 times ]

 10 Feb 2017, 10:27
Kudos
Bookmarks
Great analysis. Thanks Narenn. I have visited both the schools and they both are great. However I'd like to add the climate at Palo Alto >> Boston.

 12 Feb 2017, 07:22
Kudos
Bookmarks
 13 Feb 2017, 08:23
Kudos
Bookmarks
Thanks rohan2345 and HKD1710 for your comments.
rohan2345 There's a section in our Bschool reviews where applicants can post their school visit experiences for the benefit of other applicants. I would appeal you to post your experience of HBS and GSB visits in Bschool reviews. https://gmatclub.com/reviews/business_schools?fl=menu
I can see many people have chosen their favourite school between HBS and GSB in a poll added in the first post. It would be nice if applicants could illustrate their reasons behind choosing one school over another.
rohan2345 There's a section in our Bschool reviews where applicants can post their school visit experiences for the benefit of other applicants. I would appeal you to post your experience of HBS and GSB visits in Bschool reviews. https://gmatclub.com/reviews/business_schools?fl=menu
I can see many people have chosen their favourite school between HBS and GSB in a poll added in the first post. It would be nice if applicants could illustrate their reasons behind choosing one school over another.