Events & Promotions
|
|

GMAT Club Daily Prep
Thank you for using the timer - this advanced tool can estimate your performance and suggest more practice questions. We have subscribed you to Daily Prep Questions via email.
Customized
for You
Track
Your Progress
Practice
Pays
Not interested in getting valuable practice questions and articles delivered to your email? No problem, unsubscribe here.
 Apr 23
01:30 AM EDT
-02:30 AM EDT
Struggling with GMAT Verbal as a non-native speaker? Harsh improved his score from 595 to 695 in just 45 days—and scored a 99 %ile in Verbal (V88)! Learn how smart strategy, clarity, and guided prep helped him gain 100 points. Apr 22
12:30 AM EDT
-01:30 AM EDT
At one point, she believed GMAT wasn’t for her. After scoring 595, self-doubt crept in and she questioned her potential. But instead of quitting, she made the right strategic changes. The result? A remarkable comeback to 695. Check out how Saakshi did it. Apr 23
08:00 PM PDT
-09:00 PM PDT
Video explanations + diagnosis of 10 weakest areas + 150+ short videos + study plan! Apr 26
10:00 AM EDT
-11:00 AM EDT
The Target Test Prep course represents a quantum leap forward in GMAT preparation, a radical reinterpretation of the way that students should study. Try before you buy with a 5-day, full-access trial of the course for FREE! Apr 27
11:00 AM EDT
-12:00 PM EDT
Prefer video-based learning? The Target Test Prep OnDemand course is a one-of-a-kind video masterclass featuring 400 hours of lecture-style teaching by Scott Woodbury-Stewart, founder of Target Test Prep and one of the most accomplished GMAT instructors Apr 28
08:00 AM PDT
-11:00 AM PDT
Whether you are just beginning your MBA journey or fine-tuning your path to a 700+ score, GMAT Day is designed to give you a competitive edge.


Kudos
Bookmarks

B
Be sure to select an answer first to save it in the Error Log before revealing the correct answer (OA)!
Difficulty:
 15%
(low)
15%
(low)
Question Stats:
74% (00:34) correct 26%
(00:45)
wrong
based on 682
sessions
26%
(00:45)
wrong
based on 682
sessions
History
Date
Time
Result
Not Attempted Yet

Which of the following is the graph of the equation y = |x| for all real values of x? (Note: All graphs drawn to scale.)
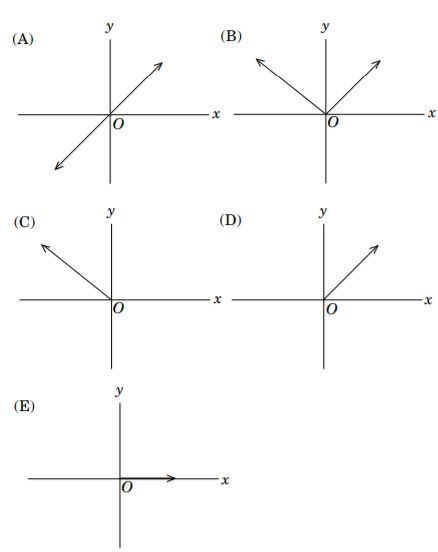

2017-12-17_1244.png [ 18.49 KiB | Viewed 17761 times ]
Attachment:
2017-12-17_1244.png [ 18.49 KiB | Viewed 17761 times ]
Originally posted by banuprakash on 17 Dec 2017, 03:50.
Last edited by banuprakash on 17 Dec 2017, 06:29, edited 1 time in total.
Last edited by banuprakash on 17 Dec 2017, 06:29, edited 1 time in total.
Kudos
Bookmarks
The domain of the expression is all real numbers except where the expression is undefined. In this case, there is no real number that makes the expression undefined.
(−∞,∞)
For each
x value, there is one y value.
Try x= 1,0,-1 then
Y=1,0,1
So if you plot
Graph looks like a V Shape
Answer: B
Sent from my ZUK Z2132 using GMAT Club Forum mobile app
(−∞,∞)
For each
x value, there is one y value.
Try x= 1,0,-1 then
Y=1,0,1
So if you plot
Graph looks like a V Shape
Answer: B
Sent from my ZUK Z2132 using GMAT Club Forum mobile app


Kudos
Bookmarks
Bunuel
Draw the graph of the line Y=X which will be a positive sloping line passing therough origin making 45º with positive X-Axis
Flip the figure of line available below the X-axis towards upside (i.e. convert all negative values of Y into positive values of Y
We get a V shape figure
Answer: Option B
ALTERNATIVELY
Keep substituting value of x and calculate values of Y and polot all the avialble points to get the graph
@x = 0, y = 0
@x = 1, y = 1
@x = 2, y = 2
@x = -1, y = +1
@x = -2, y = +2
and so on...
ANswer:m . option B