Events & Promotions
|
|

GMAT Club Daily Prep
Thank you for using the timer - this advanced tool can estimate your performance and suggest more practice questions. We have subscribed you to Daily Prep Questions via email.
Customized
for You
Track
Your Progress
Practice
Pays
Not interested in getting valuable practice questions and articles delivered to your email? No problem, unsubscribe here.
 Sep 28
07:00 PM EDT
-10:00 PM EDT
Boost your GMAT score in less than one month in a live online class + 6 months access to TTP OnDemand video courses included! Class starts Mon, Tues, Wed, Thur, Fri Sept. 28, 2026 - Oct. 16, 2027, 7:00pm-10:00pm EST Sep 29
11:00 AM EDT
-01:00 PM EDT
" Description: Top scores are possible when you enroll in a powerful GMAT course, taught live online + 6 months access to TTP OnDemand video courses included! Class starts Tues/Thur Sept. 29, 2026 - Dec. 3, 2026, 11:00am-1:00pm EST Oct 01
07:00 AM BST
-08:00 AM GMT
Welcome to the GMAT Club's Free Interview Prep Event for Top MBA Programs! Buy tickets - Virtual series that’s all set to equip you to -excel in your MBA interviews. Oct 03
01:00 PM EDT
-04:00 PM EDT
Top scores are possible when you enroll in a powerful GMAT course, taught live online + 6 months access to TTP OnDemand video courses included! Class starts Saturdays Oct. 3, 2026 - Dec. 26, 2026, 1:00pm-4:00pm EST

 06 Jul 2026, 15:14
Kudos
Bookmarks


Dropdown 1: 36
Dropdown 2: 19
Be sure to select an answer first to save it in the Error Log before revealing the correct answer (OA)!
Difficulty:
 65%
(hard)
65%
(hard)
Question Stats:
66% (02:54) correct 34%
(03:19)
wrong
based on 553
sessions
34%
(03:19)
wrong
based on 553
sessions
History
Date
Time
Result
Not Attempted Yet
\(50\) students' exam marks out of \(100\) are reported below in bar chart. The result is summarised as follows: \(8\) students attained less than \(10\) marks, another \(8\) students attained at least \(10\), but less than \(20\) marks and so on.
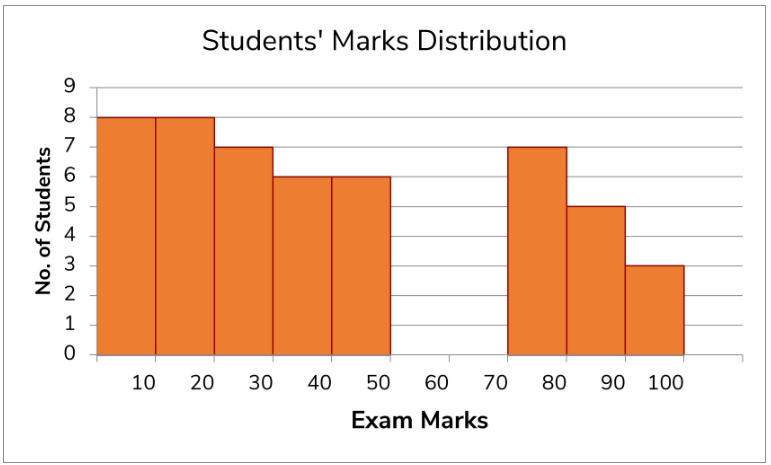
Based on the given information use the drop down menus to most accurately complete the following statements.
A. The least possible value of mean marks for the whole class of 50 students would be
B. Maximum possible no. of students attaining marks in the range of (20-46) would be

GMAT-Club-Forum-2gzs3ora.png [ 46.5 KiB | Viewed 1940 times ]
Based on the given information use the drop down menus to most accurately complete the following statements.
A. The least possible value of mean marks for the whole class of 50 students would be
B. Maximum possible no. of students attaining marks in the range of (20-46) would be
Attachment:
GMAT-Club-Forum-2gzs3ora.png [ 46.5 KiB | Viewed 1940 times ]
ShowHide Answer
Official Answer
Dropdown 1: 36
Dropdown 2: 19

ankushsambare


Joined: 13 Jun 2022
Last visit: 27 Sep 2026
Posts: 326
Given Kudos: 232
Location: India
Schools: ISB '27 Wharton '26 INSEAD Aug '26
GPA: 2.4
Products:
06 Jul 2026, 20:24
Kudos
Bookmarks
Here's the solution in simple text:
A. Finding the Least Value
Multiply each bar value by the corresponding left-side frequency:
8 × 0 = 0
10 × 8 = 80
20 × 7 = 140
30 × 6 = 180
40 × 6 = 240
70 × 7 = 490
80 × 5 = 400
90 × 3 = 270
Total value = 80 + 140 + 180 + 240 + 490 + 400 + 270 = 1800
Total frequency = 50
Least value = 1800 ÷ 50 = 36
Answer: 36
B. Finding the Maximum Value
Take the complete bar value for the interval 40–50.
Total frequency = 7 + 6 + 6 = 19
Answer: 19
A. Finding the Least Value
Multiply each bar value by the corresponding left-side frequency:
8 × 0 = 0
10 × 8 = 80
20 × 7 = 140
30 × 6 = 180
40 × 6 = 240
70 × 7 = 490
80 × 5 = 400
90 × 3 = 270
Total value = 80 + 140 + 180 + 240 + 490 + 400 + 270 = 1800
Total frequency = 50
Least value = 1800 ÷ 50 = 36
Answer: 36
B. Finding the Maximum Value
Take the complete bar value for the interval 40–50.
Total frequency = 7 + 6 + 6 = 19
Answer: 19

 08 Jul 2026, 07:50
Kudos
Bookmarks
[0,10) → 8
[10,20) → 8
[20,30) → 7
[30,40) → 6
[40,50) → 6
[70,80) → 7
[80,90) → 5
[90,100) → 3
Here we need to note that an interval contains it's lower bound and does not contain it's upper bound.
A. The least possible value of mean marks for the whole class of 50 students would be :
Consider all the lower bounds and take the average. It comes to 36.
8 × 0 + 10 × 8 + 20 × 7 + 30 × 6 + 40 × 6 + 70 × 7 + 80 × 5 + 90 × 3 = 1800
1800/50=36
B. Maximum possible no. of students attaining marks in the range of (20-46) would be
Here we add the count from :
[20,30) → 7
[30,40) → 6
[40,50) → 6
which sums to 19
[10,20) → 8
[20,30) → 7
[30,40) → 6
[40,50) → 6
[70,80) → 7
[80,90) → 5
[90,100) → 3
Here we need to note that an interval contains it's lower bound and does not contain it's upper bound.
A. The least possible value of mean marks for the whole class of 50 students would be :
Consider all the lower bounds and take the average. It comes to 36.
8 × 0 + 10 × 8 + 20 × 7 + 30 × 6 + 40 × 6 + 70 × 7 + 80 × 5 + 90 × 3 = 1800
1800/50=36
B. Maximum possible no. of students attaining marks in the range of (20-46) would be
Here we add the count from :
[20,30) → 7
[30,40) → 6
[40,50) → 6
which sums to 19