Events & Promotions
|
|

GMAT Club Daily Prep
Thank you for using the timer - this advanced tool can estimate your performance and suggest more practice questions. We have subscribed you to Daily Prep Questions via email.
Customized
for You
Track
Your Progress
Practice
Pays
Not interested in getting valuable practice questions and articles delivered to your email? No problem, unsubscribe here.
 May 22
08:30 AM PDT
-09:30 AM PDT
For many Indian MBA applicants, the default dream has long been a top US MBA. But as career goals, visa considerations, timelines, and global mobility priorities evolve, more candidates are seriously considering MBA programs in Europe. May 21
10:00 AM EDT
-11:59 PM EDT
Make the most of your break with the most realistic GMAT™ prep. Take up to $700 off select products.- Jun 10
06:00 AM PDT
-06:15 PM PDT
Register for the GMAT Club Virtual MBA Spotlight Fair – the world’s premier event for serious MBA candidates. This is your chance to hear directly from Admissions Directors at nearly every Top 30 MBA program..


Kudos
Bookmarks

Dropdown 1: 15
Dropdown 2: 2900
Be sure to select an answer first to save it in the Error Log before revealing the correct answer (OA)!
Difficulty:
 85%
(hard)
85%
(hard)
Question Stats:
53% (02:18) correct 47%
(02:24)
wrong
based on 477
sessions
47%
(02:24)
wrong
based on 477
sessions
History
Date
Time
Result
Not Attempted Yet
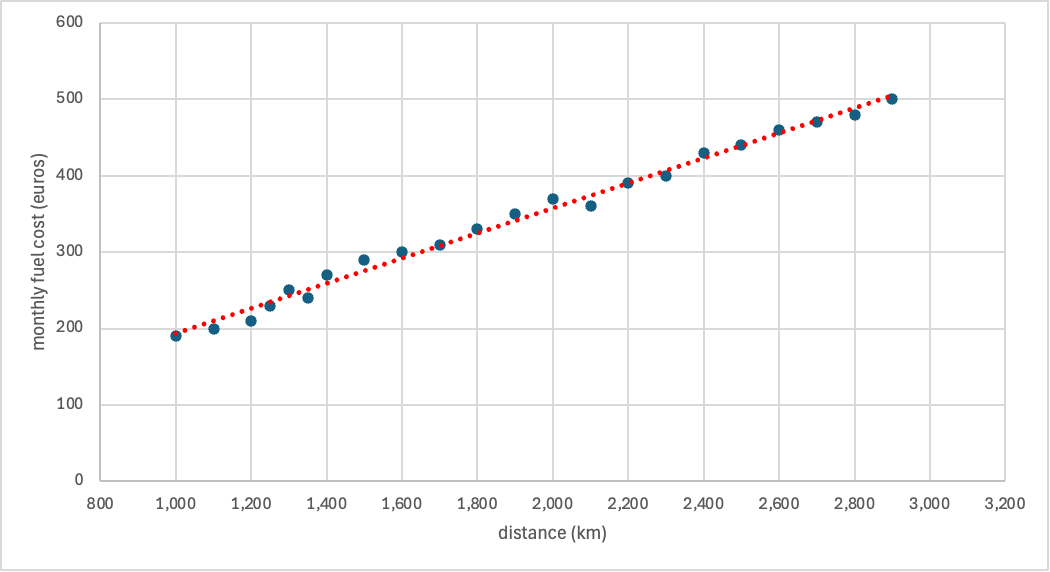
For each of 22 drivers in a logistics company, the graph shows the driver’s monthly fuel cost (in euros, €) and the number of kilometers the driver drives per month. The graph also shows a trend line for the data.
From each drop-down menu, select the option that creates the most accurate statement based on the information provided.
The trend line suggests that, for a driver who drives at least 1,000 kilometers per month, each 100-kilometer increase in distance driven corresponds to an increase of approximately euros in monthly fuel cost (rounded to the nearest €5).
For the driver with the highest monthly fuel cost, the number of kilometers driven per month is kilometers.

GMAT-Club-Forum-wk0nozm0.png [ 28.86 KiB | Viewed 2748 times ]
From each drop-down menu, select the option that creates the most accurate statement based on the information provided.
The trend line suggests that, for a driver who drives at least 1,000 kilometers per month, each 100-kilometer increase in distance driven corresponds to an increase of approximately euros in monthly fuel cost (rounded to the nearest €5).
For the driver with the highest monthly fuel cost, the number of kilometers driven per month is kilometers.
Attachment:
GMAT-Club-Forum-wk0nozm0.png [ 28.86 KiB | Viewed 2748 times ]
ShowHide Answer
Official Answer
Dropdown 1: 15
Dropdown 2: 2900


Kudos
Bookmarks
To calculate the monthly fuel cost per 1000km
We can take reference of y axis with lowest being 200 and highest being 500 and corresponding km is 1000 and 2900 respectively
So for every 1000 km there is rise of (500-200)/((2900-1000)/1000)
=300/19 = 15.78 ~ 15
Also from graph, it can be observed that the highest monthly fuel cost corresponds to 2900km
Hence answer is 15 and 2900
Kudos
Bookmarks
Bunuel
Solution:
Statement 1:
The trend line suggests that, for a driver who drives at least 1,000 kilometers per month, each 100-kilometer increase in distance driven corresponds to an increase of approximately ___ in monthly fuel cost.
Estimate the slope using two points on the trend line:
- At 1,000 km → approx. €200
- At 2,900 km → approx. €500
- Difference in cost: 500 − 200 = €300
- Difference in distance: 2,900 − 1,000 = 1,900 km
Code:
€300 ÷ 1,900 km × 100 km ≈ €15.8
Rounded to the nearest €5: €15Answer: €15
Statement 2:
For the driver with the highest monthly fuel cost, the number of kilometers driven per month is ___ kilometers.
From the data:
- Highest cost = €500
- Corresponding distance = 2,900 km