Events & Promotions
|
|

GMAT Club Daily Prep
Thank you for using the timer - this advanced tool can estimate your performance and suggest more practice questions. We have subscribed you to Daily Prep Questions via email.
Customized
for You
Track
Your Progress
Practice
Pays
Not interested in getting valuable practice questions and articles delivered to your email? No problem, unsubscribe here.
- Nov 20
07:30 AM PST
-08:30 AM PST
Learn what truly sets the UC Riverside MBA apart and how it helps in your professional growth
Kudos
Bookmarks
Dropdown 1: 8,500
Dropdown 2: Workers without a high school diploma
Be sure to select an answer first to save it in the Error Log before revealing the correct answer (OA)!
Difficulty:
 75%
(hard)
Question Stats:
55% (02:10) correct 45%
(02:17)
wrong
  based on 480
sessions
History
Date
Time
Result
Not Attempted Yet
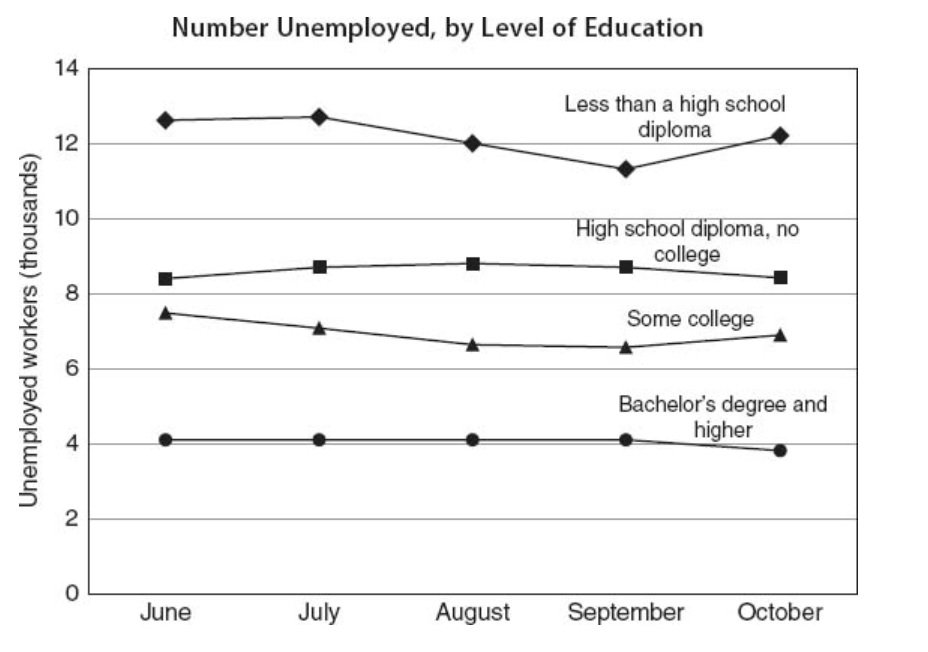
Graph shows the number of unemployed (in thousands) over a five-month period, organized by level of education completed.

2.jpg [ 81.01 KiB | Viewed 5420 times ]
The largest difference in the number of unemployed between any two groups was a difference of approximately
The greatest variation in the number of unemployed over this five month period occurred among
Question #1 based on the same graph is available here
Attachment:
2.jpg [ 81.01 KiB | Viewed 5420 times ]
The largest difference in the number of unemployed between any two groups was a difference of approximately
The greatest variation in the number of unemployed over this five month period occurred among
Show SpoilerAdditional Question
The pattern of variation in the number of unemployed among high school graduates with no college is most similar to that among____________.
(A) Workers without a high school diploma
(B) Workers with some college education
(C) Workers with a bachelor’s degree or higher
(D) High school graduates with a college education
(E) No other group shows a similar pattern.
Answer: C
(A) Workers without a high school diploma
(B) Workers with some college education
(C) Workers with a bachelor’s degree or higher
(D) High school graduates with a college education
(E) No other group shows a similar pattern.
Answer: C
Data Insights (DI) Butler 2023-24 [Question #28, Date: Oct-10-2023] [[url=https://gmatclub.com/forum/data-insights-di-butler-419150.html]Click here for Details]
ShowHide Answer
Official Answer
Dropdown 1: 8,500
Dropdown 2: Workers without a high school diploma
Kudos
Bookmarks
Part 1: The difference between the number of unemployed high school graduates and the number of unemployed workers without a high school diploma was smallest in ________.
Looking at the graph we need to figure out difference between the number of unemployed high school graduates, second line from top (square data points), and the number of unemployed workers without a high school diploma, top line (diamond data points).
As the number of unemployed high school graduates is always lower than the number of unemployed workers without a high school diploma the difference will be always be negative. Hence, the difference will be smallest when the distance between second line from top (square data points) and top line (diamond data points) is the largest. Hence, the answer should be June.
However, the answer is September.
I'm confused because of this. For September to be the answer should the question ask the difference between the number of unemployed workers without a high school diploma and the difference between the number of unemployed high school graduates was smallest in ____ ?
OR
Are we considering the absolute values when we are calculating the difference?
Part 2: The only group that saw no rise in unemployment during this five month period was _____
Less than a high school diploma - rise in unemployment from September to October.
High School Diploma, no college - rise in unemployment from June to July.
Some College - rise in unemployment from September to October.
Bachelor's degree and higher - no rise in unemployment. (Steady - July to September or Decrease - September to October.)
Hence answer is Bachelor's degree and higher.
Kudos
Bookmarks
Sajjad1994
1) In month of July, there is unemployed personnel difference amongst workers without high school diploma and Bachelor and higher degree coming around 8500 figure. ( I had hard time in ruling out 8700 as answer, need help)
2) By observational skills, its very clear workers without high school degrees are experiencing highest variation.


